Some more analysis to explain the process.
Another factor that affects the chances of high case numbers is the rate at which derivatives are added onto existing winners cases. How does that happen? Well, it is a selectee entering as single and then getting married during the DV process (see this post about how to do that), or of course babies being born to selectees. So – let’s say you have 1000 people in front of you in the DV processing line – but then one of those who entered as single gets married and that spouse has three children. The line just became 1004 – 4 more derivatives were added in front of you.
OK – why is this a problem? Well the rate of derivative growth is startling. In my mirst year of looking at the data closely I had not really realized what a big impact it was, until the end of the year.
So – how can we calculate it.
First let’s find the starting derivative rate – I actually published that on my CEAC file already. The calculation is simple. We know how many selectees were announced by KCC for each region. For AF region for example there were 45034 selectees announced as winners – and that included selectees and their derivatives. Then with the first CEAC file, we can see how many cases (one per principal selectee) we have. For AF region there are 30066. So – 45034 family members on 30066 cases gives an average derivative rate of 1.498 for AF region.
Next we calculate the derivative rate we see in the CEAC file itself. For cases shown at NVC and in Transit we do not have the family numbers yet, so I filter them from the file. The average derivative rate is then very simple to calculate on the scheduled cases.
So – here are the numbers for each region at this point.
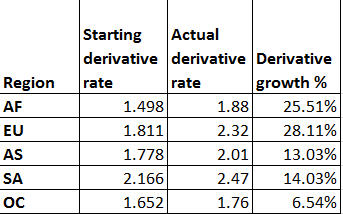
As you can see each region has already experienced an increase and in AF and EU regions this is quite profound.
What is means is that the original 45034 selectees number for AF is now 25.5% higher – around 56500 – an increase of over 11000 people. So – the new THEORETICAL effective selectee counts for each region are:
AF – 56524
EU – 34602
AS – 18956
SA – 3420
OC – 1598
Again, this is just theoretical, but it helps understand the process better.
I should also mention, that this dramatic growth rates sometimes accompany higher refusal rates, because the COs judge that the selectee got married simply to add someone to their win. If you are considering doing that, don’t. You are risking being charged with fraud, and being barred for life from the USA.
All the analysis posts.
Density
Derivative growth rate
Response Rate
Issued Rate and Predictions

January 3, 2016 at 15:57
If I’ve a kid and not married how will the co view my case.
January 3, 2016 at 17:49
That is fine.
January 3, 2016 at 18:28
brits salvation , my concerns are:
1. In the first ECAC file of January , do you think there are more applicants compared to the dv 2015 ??
2. babies born during the process of dv , they need a visa ???
3. After publication of the first file, what do you think of 2016AF510XX , he can always hope ?? there is a chance ???
thanks you
January 3, 2016 at 18:37
1. NO!
2. Yes. And they count toward the quota.
3. There is a chance, but some risk too.
February 5, 2016 at 22:02
Good evening and how are you.?first of all, they refused me on my only certificate that
i have B.E.C.E certificate. do i have a case and if not then how many years would take me be
fore traveling to the USA.and the date was 02/02/16
February 5, 2016 at 22:14
So you were refused because you do not meet the education requirement. There is no appeal for that.
February 6, 2016 at 07:07
Nathaniel, was it that the only certificate you had was ur bece certificate? was that the basis for refusal?
February 6, 2016 at 07:08
hi nathaniel, was it that they refused you cus the only cert you had was your bece cert.? was that the only basis for refusal?
February 6, 2016 at 16:11
BECE on its own does not meet the requirement.
February 7, 2016 at 06:44
Yes sir that is the only certificate i have
and can i ask for a waver. ?
February 7, 2016 at 15:55
No. You need to meet the minimum requirements.
February 7, 2016 at 06:53
So it will take how many year for me to apply for a visa.
February 7, 2016 at 06:58
I think either education or skills.
And i add my driving license to
it
February 7, 2016 at 15:55
They don’t care about your driving license.
March 10, 2016 at 14:23
cn af 43** when will 2nl be send
March 10, 2016 at 15:06
2 or 3 months time….
June 9, 2016 at 10:39
Hello Brit,
I am glad that you are helping people on DV related issues. I thank God for you. I have two questions and I hope you will help me.
1. In my original entry, I wrote my surname twice and in this case, forgot to write my middle name. My name Came as George, Nicholas George instead of George, Nicholas Ouma. I requested KCC to correct that for me but they said they cannot make corrections on eDV. However, I rectified everything in my DS 260 form. Can this affect me?
2. I have a fiancee, whom am plannng to marry before or after the interview (yet to make the decision). I already asked KCC to unlock my form to change an error on my DS 260 regarding my highest level of eduction, which I corrected and resubmitted. Is it possible to get married now and unclock the Ds260 again with more additional information or proceed to the interview and marry after the results and maybe process for her everything later?
3. Lastly, My case Number is AF2017000151xx, how soon can I expect my interview?
Thank you so much, looking forward for your feedback.
June 9, 2016 at 14:21
1. It can, but hopefully won’t. It would be an issue in Accra embassy.
2. Marry early, don’t try and do it later.
3. Read the basic questions post.
December 16, 2018 at 21:30
Dear Brit, I understood how to calculate starting derivate rate, but couldnt understand how to calculate last one. Which CEAC data we need to use?
December 17, 2018 at 02:39
The final file from the end of the year, which of course we won’t have until the end of the year. Use the 2018 file for an approximation.