In a previous post I explained some analysis which tried to estimate the number of selectees notified in the 2nd draw. That post can be referenced here.
Today I have taken the highest case numbers allocated for each region and by comparing to DV2015 and DV2016 data I have built a pretty accurate estimate of the number of cases in each region. Adding in the known derivative rates (based on DV2016 derivative rates) we can get a pretty good idea of how many selectees are in each region, and take a guess at how many selectees were notified in the 2nd draw.
Here are my numbers:-
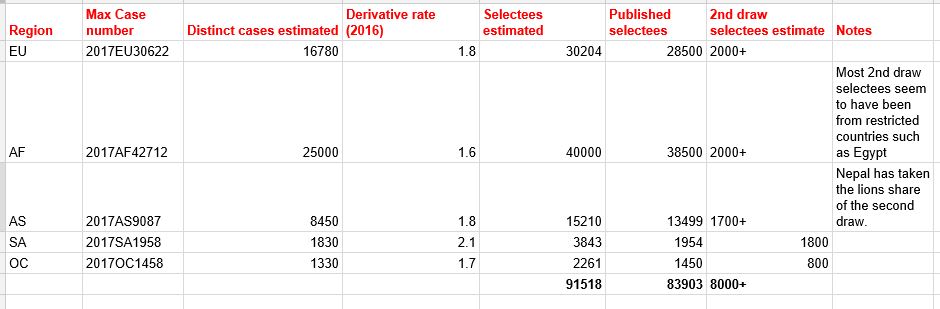
The numbers in some regions are understated because countries that were limited in the 1st draw have lower case numbers and so would have received additional selectees without increasing the max case number. This means the 2nd draw estimate numbers above are on the low side (for AF, AS and EU). So – I believe the 2nd draw added about 8,000 to 10,000 additional selectees.
I have now seen the official results of the DV2016 lottery, and we know the quota was underfilled in DV2016 – Having looked at that data I am hopeful that all regions will go current in DV2017. However, I can’t be 100% certain of course, and I believe the highest risk is for the highest case numbers selectees (2nd draw) in Nepal and the highest case numbers in SA region. I can’t predict any final cutoffs, but both those cases have some cause for concern.

January 16, 2017 at 19:31
How do I access your google sheet to view the CEAC data ?
January 16, 2017 at 19:51
I don’t have a complete extract, so there is no google sheet to access.
January 17, 2017 at 01:32
I was wondering, since you can no longer pull data from CEAC, why don’t you create a shared spreadsheet of sorts (by region) for people to help you gather at least chunk of the data? It would be helpful, I believe.
You have so many readers and I am sure that all of us would be happy to spend 20-30 minutes checking CNs in CEAC to update the info, this is the LEAST we could do for everything you do for us. Personally, I am just waiting and going crazy, so it would definitely be a nice distraction =)
January 17, 2017 at 04:02
I have chunks of the data. But without it being complete and able to be updated it isn’t that useful.
January 18, 2017 at 15:40
I have case number 2017AF11xxx when should expect a call for an interview?
January 18, 2017 at 15:57
That number is current. So – when did you submit your DS260?
January 18, 2017 at 16:01
Thank you for your concern
I submitted my ds-260 on the 29th july 2016
January 18, 2017 at 16:17
You will probably have a March interview. 2NL in the next few days, this week or maybe next week.
January 18, 2017 at 19:47
Dear Sir
Our case number is AF385xx and we are from Egypt, our understanding that this case number for Africa. Is it different than our number on Egypt since the visa bulletin showing Africa number for 28700 while egypt 18800 so which number we have to follow so that we can trace our case. Thank you for your help
January 18, 2017 at 20:53
The Egypt number, until Egypt is not called out separately.
January 21, 2017 at 19:59
Dear BritSimon, please thanks for your information and helps too. Please my question is this, my case number is 20182P, when am I supposed to check mine.. thank you for your help.
January 21, 2017 at 21:58
The 2018 results will be out in May.
January 26, 2017 at 20:14
hello my case #ptp201xxx;xxx I send my DS260 December 12 when I should expect my interview
January 26, 2017 at 23:00
That isn’t a case number.
January 26, 2017 at 23:14
Thank you BritSimon, I was scheduled for an interview
February 2, 2017 at 18:39
yes miss PTP20168 I send my DS 260 December 12 n they send my case to a supervaser review January 24 when I should expect my interview please
February 2, 2017 at 19:01
I have no idea. I advise on DV lottery and he case you have provided is not a DV case.
January 30, 2017 at 04:00
Hi Brit,
My case no. is 2017OC88*. when can i expect my 2NL ? i submitted my ds-260 is May 30 & re-opened last November. So please just give a prediction.
January 30, 2017 at 06:38
Next month.
February 1, 2017 at 12:01
My case number is AF219xx and I am from Egypt, Can I expect second letter in April?
February 1, 2017 at 18:55
Wait and see.
February 2, 2017 at 11:11
Hello Brit,
Am a DV lottery winner and my case number is 2017AF000075xx. I have already had my interview. I want to check my visa status. How do i go about doing that. When i enter my case number, it keeps telling me that its wrong
February 2, 2017 at 17:43
https://britsimonsays.com/2017-ceac-system-available/
February 26, 2017 at 20:24
Hi friend
Just a few questions please.
Why did last years OC region case numbers finish a fair bit lower then previous years?
My OC case number is in the 11XXs
Do you think I will get a interview?
Thanks for your time.
February 26, 2017 at 23:22
They under selected last year. That number should be fine this year.
February 27, 2017 at 14:16
Thanks for your time 🙂 much appreciated
February 28, 2017 at 16:05
hello britsim why do it being delay to come 2nd letter
February 28, 2017 at 17:34
KCC have lots of work. Relax.
March 1, 2017 at 07:52
thank you
March 21, 2017 at 07:29
Dear Britsimon,
Our case number is AS00078XX. I completed the DS 260 on 26 sep 2016. Could you please tell When I can expect an interview? Many Thanks.
March 21, 2017 at 13:09
Assuming you are not from Nepal or Iran, then May or June.
March 23, 2017 at 05:54
Thank you. Is it okay to submit AOS now itself or should I wait till they call for interview?
March 23, 2017 at 13:52
Do you mean adjustment of status???
March 29, 2017 at 07:23
Hi Britsimon, like you said I received 2nl today. Should I take an affidavit of support or bank statements to the interview? It’s not mentioned in the required documents list.
March 29, 2017 at 18:47
https://britsimonsays.com/all-about-public-charge-affidavit-of-support-i-134/
July 10, 2018 at 19:31
Helo Britsimon! I am selected for dv lottery for 2019. My case number is AS1660 from Nepal. When will do i get second letter? What is the chance of getting second letter?
July 10, 2018 at 20:25
You have months to wait yet – patience.