The response rate of each region is worth watching. The response rate will be varied by region and is directly impactful on what case numbers we see at the end. If less people respond, final case numbers go higher.
Every year, there are some people that do not proceed with their win. We call them “non responses” and this year we can identify them as the cases that are current but still showing “at NVC” in the CEAC data. However, we also know that someone may simply have submitted their form late and is waiting for that to complete. That case will also show as “at NVC”. So – we can look at the non response rate, but remember it is still “maturing”
This year, for the first time, the new DS260 form was introduced. We know the processing has created a backlog of processing, but it is also possible that the new form had an impact on how many people responded. Perhaps the change meant less people could get help with completing the forms, or perhaps having the form online made it more or less likely that people would complete it – we just don’t know. So – I took a look at the response rate thus far.
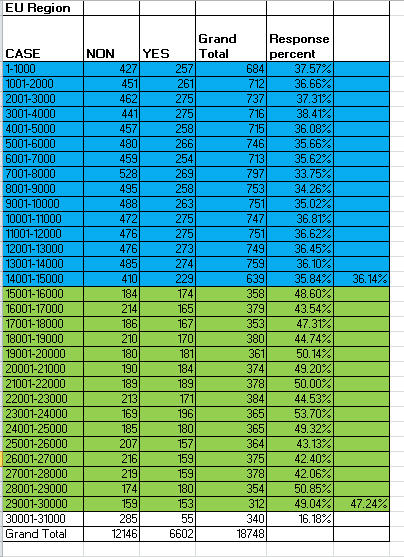
What was interesting to me was in the case of EU and AF there seems to be a change in the response rate between lower numbers and higher case numbers. If you take a look at the charts below you can see that EU has a low response rate in the early case numbers and the average response rate increases. This is due to Uzbekistan and Ukraine. Both have very high entry rates – but very high agent involvement and it seems a lot of their winners just don’t bother proceeding. This is significant as it has caused me to understate the response rate as 40%, when in fact we can see that the going forward response rate for EU will be at least 47% – and will rise from there. That number one month ago was 42% – so it seems likely the response rate will mature to over 50% in the next month.
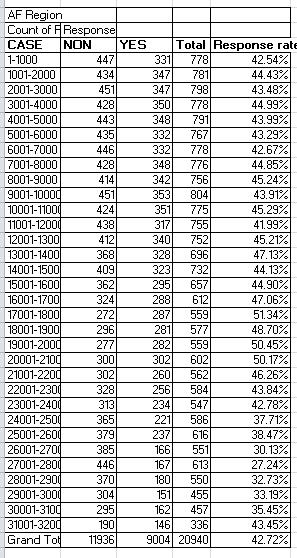
In AF region, the average response rate drops in the low 20K range. The reason for thisis because of the two countries limited in the VB, Egypt and Ethiopia. Those cases may have responded, BUT they are not current so they show as “at NVC”.
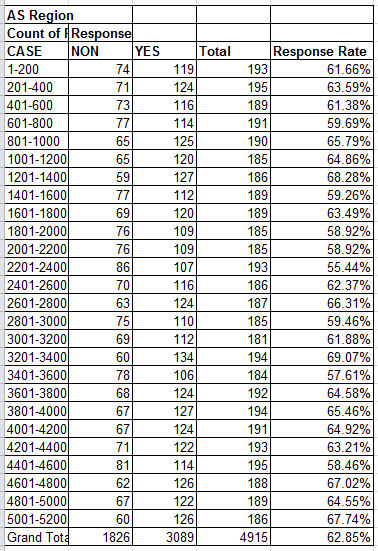
AS region is less revealing – and I have included it for completeness only. The average of 63% applies throughout the range.
Hope that is interesting to some of you. All this information educates and demystifies the whole process. It is useful to analyze the data and make sure the patterns we see can be explained. I will keep an eye on this and issue an update at some point in the future.
Response rate analysis as of March

March 27, 2015 at 23:20
So no chance for the EU to go currents ??
March 27, 2015 at 23:30
Still a bit early to say for certain – but if I had to guess I would say no.
March 27, 2015 at 23:55
Is it any chance for the AF to be current ?
March 28, 2015 at 02:01
No.
March 28, 2015 at 00:28
Hi Brit, looking at the current info available, is it possible for the VB to go high in the remaining 4mnths for AF region? Do you think AF 742## stand a chance?
March 28, 2015 at 02:03
Only a small chance…. you just need to wait and see….
March 28, 2015 at 04:10
Do you think EU will go past 36xxx ?
March 28, 2015 at 04:16
Yes.
March 28, 2015 at 05:40
Do you think Nepal will go past 8000? And what about Asia?
March 28, 2015 at 06:20
https://britsimonsays.com/update-regarding-nepal-and-asia/
March 28, 2015 at 08:51
Dear Simon,
Following this analysis what do you think of the boxes in this range (AF60000-AF62000) they may have good luck but Is it safe.
Thank you in advance
March 28, 2015 at 16:10
Almost 100% safe.
March 28, 2015 at 17:08
Thanks . But Almost LOL
Thank for all Mr BRIT
March 28, 2015 at 09:10
Bristsimon why u say no for a chance to africa to go current? It isnt early to give this kind of answer? Looking your analyz (43%) of response for af why cant africa go current at end of this proccessus? Thank
March 28, 2015 at 09:25
Mr. Brit, I thought to ask the same question: if indeed the overall response rate and the small CN remains low , Africa will have the chance to be current .
March 28, 2015 at 16:13
The key word is IF.
March 28, 2015 at 17:09
IF .
March 28, 2015 at 16:13
58000 people are chasing 22000 visas The 58000 is growing as people get married and have kids. We are clearly going to see a response rate of 55/60% by the end and approval rates are probably around 75% outside of the “wild west” countries.
March 28, 2015 at 17:18
The only slim chance for Africa to go current is if the response rate stays beyond 50% and a 75% or less approval rate. I’m not sure though if Africa ever had that low response rate in the past Dv’s.
March 28, 2015 at 17:26
I meant the response rate stays under 50%.
March 28, 2015 at 17:27
Exactly. In DV2012 there was a redraw after the first results were published. AF region was particularly badly affected. So – AF region has demonstrated that its response rate can be affected by “challenges”. The question is – will the DS260 be that type of challenge (i.e. a new process that causes less to process their forms).
March 28, 2015 at 11:57
Hey thanks for your all analyses.With the current response rates do you think there is a chance for past EU42xxx?
March 28, 2015 at 16:15
Gut reaction, no. We can only wait and see.
March 30, 2015 at 07:05
What is that chance (percentage) of passing over EU42xxx? 🙁
March 30, 2015 at 15:14
I have not worked out percentages…
March 28, 2015 at 12:30
Hi Simon,
I can’t understand why, for EU, are you talking about the higher response rate after 15,000 CNs? First, almost 11,000 cases are below 15,000, which is more than half of all the cases, so lower response rate in this range will result in much higher final cut off and even high chance of becoming current. What matters is the overall response rate, which is now 40%, and the fact that the response rate for cases higher than 15,000 will get higher than 50% is not relevant.
Further, another important criteria is the visa issuance rate, which is not presented in your analysis. Visa issuance rate can also have a significant impact on the final cut-off.
By visa issuance rate I mean the percent of visas issued from all the current and processed cases. Last year for EU that was about 74%.
Thanks!
March 28, 2015 at 16:28
You are missing the point. Outside of the two limited countries, the response rate for the U2 countries ( Uzbekistan and Ukraine) is obviously the reason the response rate is lower in the early ranges. Perhaps you haven’t read my previous explanations of why the debsity is so high in that earlier range and that the selectees from the U2 countries are all concentrated in that first 15k. OK so the real response rate (outside of the U2) is already 47% and because the U2 countries are exhausted, that will be the minimum response rate from now on – probably increasing to 60%+ by the end of the program. Now – if EU response rate is 65% or lower and approval rate is 75% or lower – EU goes current. But, if response is 70% and/or approval is 80%, then there are risks of cutoffs. As I have said before, of all the regions EU is “closest” to being able to go current – but previous response and approval rates from previous years means cutoffs.
March 28, 2015 at 16:45
And to be clear – we can apply a low response rate to the U2 countries and a low approval rate too. So – they account for 10k of the 40k selectees. They might end up taking 3000 or 4000 of the 20k visas. The remaining 30k selectees (plus new derivatives) will then compete for 17k or 16k. Again – 17k would be better than 16k. In fact at 17k I think we could almost cope with 70% response AND 80% approval.
March 28, 2015 at 17:33
There is no info of the previous years’ response rates, so we can only guess them. Further, in the last 2 years EU’s approval rate was 75%. As you mentioned peaople tend to behave similarly year to year.
Further, if U2 countries are exhausted in the first 15,000 CNs and the response rate due to these U2 is low then the total response rate will continue to be low irrespective of the higher response rates for CNs of higher than 15,000.
Again I cannot understand why we should ignore the U2 countries’ low response rates for predicting the final cut off. So at this point not 47%, but 40% is the total response rate, which matters. Don’t you agree? or you think that the U2’s response rate will increase over time?
March 28, 2015 at 17:49
What I am saying is we should treat U2 response and approval rate separately to the Rest of EU. It is a distinct group of 10k selectees that will behave differently to the other 30k.
Yes the U2 response rate will continue to rise, as will the RoEU.
As for which number to use – well the next VB will be based on a group of people working on a 47%+ response rate, not a 40% response rate.
March 28, 2015 at 19:41
Simon, thanks for the info. it seems that at 3.5 visas for U2, EU could go current with response rate at 60% and approval rate of 80% for the remaining EU countries. Could you please confirm my analysis?
March 28, 2015 at 20:03
Yes agreed.
60% would be a big surprise compared to previous years. So – the number that is currently 47% is what we need to watch…
March 28, 2015 at 21:03
do you mean 60% is a low figure compared to previous years and we should expect higher than 60% this year?
So far we do not have any data about previous years’ response rate.
how you know 60% is a high or low figure?
March 29, 2015 at 00:43
We can work backwards from previous years. Last year for instance the cutoff was 40150 and the highest EU number was EU56XXX. Then we can compare to rates in DV2013. So yes, if 60% was normal, there would not have been a cutoff last year…
March 29, 2015 at 06:44
So to summarize, how much is your guesstimate for the response rates of 2014 and 2013 years? at least roughly.
March 29, 2015 at 15:33
I don’t have 2013 data to hand but EU 2014 was about 68 to 70% response rate and 75% approval rate.
March 29, 2015 at 15:34
And again – that is a blended rate with U2 countries included….
March 29, 2015 at 07:00
and let’s not ignore that last year there were 6589 more selected than this year.
March 29, 2015 at 15:39
Obviously I don’t ignore that!
March 29, 2015 at 16:27
how you know of blended 68-70% response rate for EU 2014? do you have any source?
March 29, 2015 at 20:19
I have the final file from 2014 (published on my blog). . From that I calculated the EU expected cases and worked out the result. You can do the same.
March 29, 2015 at 17:29
Even if for 2014 it was 68- 70% this year the progress shows that it is unlikely for the blended rate to get so high, probably due to U2 or ds260 fiasco. do you agree?
March 29, 2015 at 20:21
Well that is what we don’t know yet.
March 28, 2015 at 14:41
Hello Britsimon,
Please tell me what they mean by a response rate? and what it has to do with the final cut offs for regions?
I know that at NVC shows to everyone whose forms aren’t processed, and/or who’s not current yet.
thanks in advance
March 28, 2015 at 16:56
Perhaps someone was selected but decided they did not want to proceed with the application. That would be a non response. So – the at NVC includes 3 groups.
1. Those not yet current.
2. Those who are current but not yet scheduled because they were late with the DS260.
3. Those that will never respond.
At the moment the NON responses are 2 and 3.
March 28, 2015 at 15:34
Can you plz explain the response and non response rate of only Nepal up to now and also the final response rate of Nepal .
March 28, 2015 at 16:59
The point about a NON response is that we cannot tell which embassy the case comes from. So – there is lots of data available – I suggest you check that and read my previous posts where I have explained how many Nepalese there are in each thousand.
March 29, 2015 at 00:16
Hello BritSimon
Thanks for your valuable information.
According to the current new updates, do you thing there are possibilities for high African number AF80XXX to get interview chance, and about how percentage do you see that ?
Thanks
March 29, 2015 at 00:44
Very low chance – that would take an almost unprecedented low response rate.
March 29, 2015 at 01:04
yea thank you mr Britsimon again am really confused how the case numbers are dealt with in the visa bulletin; i want to know if the 125000 selectees is just for Africa alone or is for all the regions? if is for all the regions then i want to know accordint to my own understanding if that is it.i calculated the total for all the regions on the visa bulletin which i got 57906 . if so it means there is only 67094 case remaing from the total seleeectes. please make this clear for me.
March 29, 2015 at 15:37
125 is among all the regions. 58000 is AF only. Those numbers INCLUDE derivatives, meaning the number of cases is less – the AF number of cases is just under 40000. Each case includes the derivatives on the case. The case numbers are not consecutive – so there are gaps between the cases so you cannot add the numbers on the VB – that doesn’t mean anything. The highest AF number is 89799. Read my “holes theory” post to understand that all better.
March 29, 2015 at 04:05
Thanks a lot for information given. Do you think AF648XX has a good chance for 2ndL? Thanks.
March 29, 2015 at 15:37
Good chance – yes.
March 29, 2015 at 05:26
what about AF69***
March 29, 2015 at 15:38
Still some chance – but risky of course.
March 29, 2015 at 05:47
Britsimon, which cut off are we looking forward to for AF by the end of the fiscal year?
March 29, 2015 at 15:39
We are all wondering that!!
March 29, 2015 at 10:45
Good Morning Brit, I will like to know if there is possibility for AF75xxx. Do you think for AF this year cut off period will be around AF81xxx like last year?
AF
March 29, 2015 at 15:44
I don’t think the cutoff will be as high as last year. Nigeria being out means all the condensed into a smaller range, so 81100 in DV2015 is much higher than 81100 in 2014. 75XXX has a chance, but a small one. The chance will depend on how many AF selectees have responded, which might have been affected by the DS260.
April 4, 2015 at 08:33
Dear Simon
What is the current response rates for Africa. What is the impact of density on the evolution of the visa bulletin ?
April 5, 2015 at 23:25
The response rate is clearly shown in this article.
Reducing density can enable higher VB jumps in later months of the year.
April 6, 2015 at 08:25
Thanks
March 29, 2015 at 13:07
Im from nepal n my case no is at 808* so do i have some chances of getting second letter or not?? If yes then wht is my possibility ?? 50/50 or a bit more from that ??
March 29, 2015 at 15:46
You have some chance – but I can’t guess the percentage.
March 29, 2015 at 15:04
Sir
One of my friend also the winner for 2015 and his case number is around 5400.I think he will be current in next VB.when he filled his ds260 at that time he made one mistake ie he filled wrong address.I wanna ask that what to do unlock his ds 260? Is it possible to unlock now. He is also from Nepal. My CN is around 7900 is there any chances to get 2nd letter if yes when it will be current I am panic too much plz suggest .I am also from Nepal. Thank you…..
March 29, 2015 at 15:45
Your friend should not unlock now, there is no need he can make that change at the interview.
You still have a chance, although there is obviously some risk. If you get an interview it will probably be in August with a June 2NL.
March 30, 2015 at 01:15
can you tell me please when i’ll recieve the 2ndL
March 30, 2015 at 15:38
my Cn is :AF60XXX
March 30, 2015 at 11:22
This may be a silly question, but , as each months numbers come in, you will be able to get a slightly better picture of the response rate, and therefore the cut-offs, right?
So, a while ago you predicted 68-72k for AF cutoff. Will you become more sure on this number with each month, or will it be just as uncertain until end of Sep as it is now?
This is just for planning (do I hold out thinking there is a small chance with AF70xxx for another 4 months, or will the next bulletin provide more hope/ closure that its finished and I should explore other options)?
March 30, 2015 at 15:45
You will have to wait until July to be certain – your number isn’t low enough to be safe, and not high enough to be with no chance….
March 30, 2015 at 13:16
This issue is real depressing. Brits, when the say 50,000 available visa, do they mean 50,000 peoples for visa or more than that. To elaborate more, one principal might have 5 dependent, that means six visa will go out to that principal. Does that 5 visa counts in to that allocated visa ,50,000 per year.
What wrong with AF region, I think KCC should try to make the cut off for AF higher number, so that to speed up the process
March 30, 2015 at 15:44
In your example the family of 6 would be a 6 of the 50,000. There is nothing wron with AF – they have a quota of about 22000 max for Africa – so they need to allocate 2000 per month – there is no need to go faster than the pace they are already doing.
March 30, 2015 at 14:41
Hi britsimon
Any idea what month AF528xx will have an interview. You had mentioned you believed this number is safe. Safe or 100% safe?
Also to get your predictions for AF do you say for instance, they want to schedual around 1600 interviews. New cases to be current in June will be about 20% or so since there’s an 80% backlog right now. And assuming 43% approved. So around 460 new cases? I read your above post re:AS #s but didnt understand how you got to your AF predictions? Please can you explain when you get a chance. Mucho gracias:)
Ps. Very happy to have found your blog.
March 30, 2015 at 15:54
100% safe.
I suggest you read the example again – it is the same explanation. At some point I may post again with AF, but I’m not sure when I can do that…
March 30, 2015 at 16:51
Hi Britsimon
what are you think about EU409## ?
I sent form in july.
Thank you!
March 30, 2015 at 16:54
Hard to say at the moment. Originally I would have said that was in the risky zone, but the response rate for EU is relatively low at the moment – so all you can do is wait and see…
March 31, 2015 at 16:08
Hi, If we see EU hitting say circa 34k (which I know you dont think will probably happen) then would you be confident on EU hitting 40k with 3 bulletins left after this??? What kind of confidence would you hold if that was the case. It would really have to fall off a cliff to not get from 35 to 40 in the 3 last VB’s.
March 31, 2015 at 17:13
Don’t forget there is a quota. So – it isn’t only month to month pace, but when the cliff is reached. So – they might do as they did last year where EU VB was maxed in August. That would just leave late DS260 cases to be interviewed in September. I’m not saying that will happen – just one possible way to play it.
March 30, 2015 at 16:32
Ok, thanks. I love hearing your analysis/updates! You are the best blog/forum out there!
March 30, 2015 at 16:52
Thanks!
March 30, 2015 at 16:48
my Cn is :AF60XXX can you tell me please when i’ll recieve the 2ndL
March 30, 2015 at 16:58
I have answered you, but you chose to ignore my comment I guess. 2NL in June or July.
March 30, 2015 at 17:43
Hi Simon!
would you please comment on the EU 2014 response rate calculation below?
46589 (number of winners) / 1.82 = 25575 (number of cases). 40150 (cut off)/ 56000 (highest CN) = 72%. 25575 (total number of cases) * 72% = 18336 (current number of CNs). 11064 (number of respondents) / 18336 (current number of CNs) = 60.3%.
Thanks
March 30, 2015 at 18:23
It is too simplistic. You are assuming the cases are evenly distributed between the 56k – they aren’t. You also need to consider the entry derivative rate versus the reported derivative rate.
I have taken those things into account, hence why my numbers are different and more accurate.
March 30, 2015 at 18:58
So the reported derivative rate will tend to increase the response rate in the calculations and the more dense cases at the beginning will tend to decrease?
March 30, 2015 at 19:09
Derivatives increase yes.
Density decreses.
March 30, 2015 at 19:16
Reported derivative calculations is very easy to calculate 24570/11064=2.2 vs 1.82 (entry derivative rate). So the reported derivative rate is more by 22% than the entry derivative rate. This is a huge difference. The most complex is the density assumption where we can only guess. Can’t we?
Thanks a lot for your input, Simon!
March 31, 2015 at 05:34
I applied the density for 2015 and the recorded response rate for 2014 to approximate the response rate for 2014 and got around 67%.
Simon, do you think that the density of 2015 can be applied for this purpose?
I have a feeling that in 2014 the density after 40,000 CN was very sparse.
March 31, 2015 at 17:00
You’re getting closer – I came to 68 to 70%. I have a post explaining the density for 2015 – so yes that can teach us how it would have looked in 2014, although I think the density is marginally higher this year.
March 31, 2015 at 17:40
So what is your combined response rate prediction for 2015?
March 31, 2015 at 17:53
As I said – I think it is better to treat the U2 countries as a separate group. In that case I expect the response rate for the non U2 countries will be over 75% and the approval rate for that group will be over 75% also.
The density in the last few thousand EU cases is around 370 cases per 1000 – hence my earlier comments that it would not take a huge difference in response or approval rates to cause EU to get close to 45006.
April 1, 2015 at 04:31
So to conclued, in terms of CNs, do you mean by U2 below 15000 numbers and non U2 above 15000?
Thanks!
April 1, 2015 at 05:40
No. You should read my holes post to understand more. U2 numbers are in the first 15k, but there are non U2 cases in this 15k also. That is why the density us so much higher in the lower ranges.
April 1, 2015 at 08:42
Could you please share the link? I found 2 posts on holes theory, but found no much info of U2 there.
Thanks
April 1, 2015 at 14:23
Read this one – and check the EU graphs. The holes posts explain what happens, this post illustrate it (once I had the actual data).
https://britsimonsays.com/dv2015-analysis/
March 31, 2015 at 10:24
thanks mr brit for your responses, it means the last three months they will be much work load working on so many case numbers in a short period of time? especially on AF region? when do you think AF 45xxx will receive the 2nl ? thanks in advance.
March 31, 2015 at 17:06
Yes the last part of the year is usually the busiest period.
I would hope you would be current for a July interview…
March 31, 2015 at 12:52
Hi Simon
My cn is around 840x Iran
Do you think we will get current? If yes when ? And in that time is there the risk of visa number running out like what happened last year in early September ?
March 31, 2015 at 17:09
You will get current – that is certain – I would guess you will be current in August. Your big risk is AP – there would not be enough time to conclude a typical Iranian AP case started in August.
March 31, 2015 at 19:05
Thanks Simon for your time and efforts wish u prosperous times in all direction of your life
March 31, 2015 at 19:20
Thank you Ali!
March 31, 2015 at 20:07
Thanks Simon for your time and efforts. These information are very helpful. In fact I have subscribed to your blog and even liked your Facebook page. Please forgive me this question(s) has already been answered by.
1. What is 2NL?
2. Is this case # (2015AF00041XXX) save and when do you think will be for interview ?
Again, thanks for your hard work
March 31, 2015 at 20:16
1. 2NL is the second notification letter – this is the appointment schedule.
2. Yes – very safe number – 100%
March 31, 2015 at 20:22
Thank you VERY much for the prompt reply. Question #2 is in two part:
When do you think will be for interview ?
March 31, 2015 at 20:48
Probably July.
April 1, 2015 at 10:45
Hope so Mr.Brit. thanks for your response and time.
April 1, 2015 at 14:34
hii sir
i’m from africa , and i ‘m afraid about my cn , please tell me
1-my cn is AF49XXX , it’s safe ?
if yes tell me please when i will passe the interview ?
thank you very much sir
April 1, 2015 at 14:39
You are worrying for nothing – the number is safe.
interview in July/August.
April 4, 2015 at 19:38
Dear Simon
I don’t know how to thank you for your great effort and help substantial help for everyone here in this DV thread.
My Cn is AF 59 *** . I am just really worried about my high CN and i am wondering?
Is it a safe one ? if yes,How safe (%) ?
When to expect my No. to go current ?
when to expect my interview?
Your response is really appreciated,,in advance 🙂
April 6, 2015 at 00:17
Your CN is not that high – I would say 100% safe – probably August interview, maybe September.
May 2, 2015 at 14:12
you please cancel my original reply.. i put my email instead of my name by mistake, i don’t want my email to appear publicly.
Thanks
May 2, 2015 at 18:39
Deleted the other post. Your question was “From Syria with CN# AS 124** any Chance? If yes when? Is there any possibility that AS will go current this year?”
There is some chance for your number – depends on Iranian AP processing. There is NO chance that AS will go current.
May 2, 2015 at 18:53
Thank you