OK – we now have the full data file for all regions. Firstly a big thank you to Xarthisius who has worked hard to implement the solution, and has singlehandedly kept the scraper working as much as possible. I also want to thank everyone who participated in the effort. Over 500 people helped, and of those people, more than 30 people scraped at least 1000 case numbers.
So – what have we got for that effort? Well I am going to make the data file public so that people can see the data. It is important to understand that we will have to continue to scrape over the coming months in order to capture progress. We will want to see ongoing numbers changes to the data. However, we won’t have to check every number from now on – so there is no need for people to put so much effort in. We don’t have to continue to check case numbers already shown to be holes, and also we don’t have to check certain statuses like refused or issued. Furthermore, we will restrict the checking to only those case numbers that are current. So, if people can just come in and scrape a few numbers each day, that will be enough to capture all we need to see and for the data to remain fresh.
Now – what do we see from this data? Well, this will be a long post because I have to explain some concepts and show how it relates to our data. Some of this is basic understanding – but let’s go over it anyway – just to make sure everyone understands.
The first thing to understand is the draw process. The draw is actually regionalized. Case numbers are assigned in numeric order within each region – all starting at 1. So, there is a case number 2018AF1, and there is also 2018EU1, 2018AS1 and so on. So, we know that based on the country of chargeability, entries are allocated into one of the six regions, and each of these regions has it’s own draw process in effect. I tend to discuss the five large regions (AF, EU, AS, SA and OC). North America (2018NAXXXXX) is so small there are only 9 or 10 case numbers. If you are concerned about NA region – contact me direct.
So – let’s say you are Australian by birth. When you enter, you have the same chance of selection as everyone in the OC region. Some countries get more selectees simply because those countries have more entries – so if country A has twice as many selectees as country B, it means they had twice as many entries. Some countries have MASSIVE numbers of entries, and that is probably due to “agents” publicizing the lottery and either facilitating the entries OR even generating entries programmatically – sometimes without the knowledge of the supposed entrant, but more of that later. The draw system is random and each entry has the same chance as any other entry in the region, so if a single country submits 30% of the entries for the region as a whole, that country will get 30% of the selectees.
OK, having explained that, let’s talk about holes. A hole is when a case number has no selectee. So for example if you check the following cases 2018AF1, 2018AF2 and 2018AF3 you will see that 2018AF2 doesn’t exist. That is a hole.
Holes come from two sources – the first source is cases that are disqualified during the draw process for various reasons such as an improper photo, or duplicate entries. Secondly holes come from countries that are limited during the draw process. Let me explain that second type of hole.
If you look at EU selectees by country as announced by USCIS (on the July 2017 visa bulletin), you can see there are 5 countries that have around 4500 selectees (Uzbekistan, Ukraine, Russia, Turkey and Albania). That number (4500), is also seen in other regions – so it is obvious it is a type of artificial limit placed on the country during the draw process. I have been seeing this same phenomenon for several years – and this results in a stepped reduction in “density”. Density is the number of real cases per N number of case numbers. So – let’s imagine we took cases from 2018AF1 to 2018AF100. If there were 40 holes we would have a density of 60% in that range of 100 case numbers. Why does that happen? I can explain it this way:
For simplicity let’s ignore derivatives for a moment.
Let’s imagine a region that has only 3 countries, and instead of 4500 being the limit, let’s assume the limit is 5000.
Country A has 100k entries. Country B has 1 million entries. and Country C has 4 million entries.
The chance of being selected in that region is 1%. The numbers are picked at random, so the countries would get the following distribution. Each time country A gets a selectee, country B would have 10, and country C would get 40.
So country A would get 1000 selectees and those selectees would be spread out across the whole case number range of case numbers.
Country B should get 10,000 selectees, but because of the limit, they only get 5000. However, ALL their 5000 at in the first half of the number range.
Country C should get 40,000 selectees, but because of the limut, they only get 5000. However, ALL their 5000 would be in the first 12.5% of the total case number range.
If the case numbers went up to 50000 (which takes into account some number of disqualification holes), we would see density reduction at 6250 (country C), then at 25,000 (country B).
So – as you can see the density is very important. Why? Well in the last VB, the max case number made current went from 8200 to 10700. Looking at the data, that 2500 number increase included 1991 real cases. The rest of the numbers were holes. So – because the density decreases after 10700, to get the same number of cases (1991) would now require an increase to 2018EU14333 – that is 3633 case numbers. Now – in reality, the way the VB progress is determined is more complicated that that simple formula – but it makes the point clear. As density decreases, VB progress can increase. And, three regions (AF, AS and EU have density decreases because of draw limited countries.
By the way – this 4500 number and the concept of limiting countries duringb the draw is only loosely related to a rule you may have heard of that no single country can receive more than 7% of available visas (globally). That rule is correct and real, BUT limiting a country to 4500 selectees is NOT how that 7% rule is enforced.
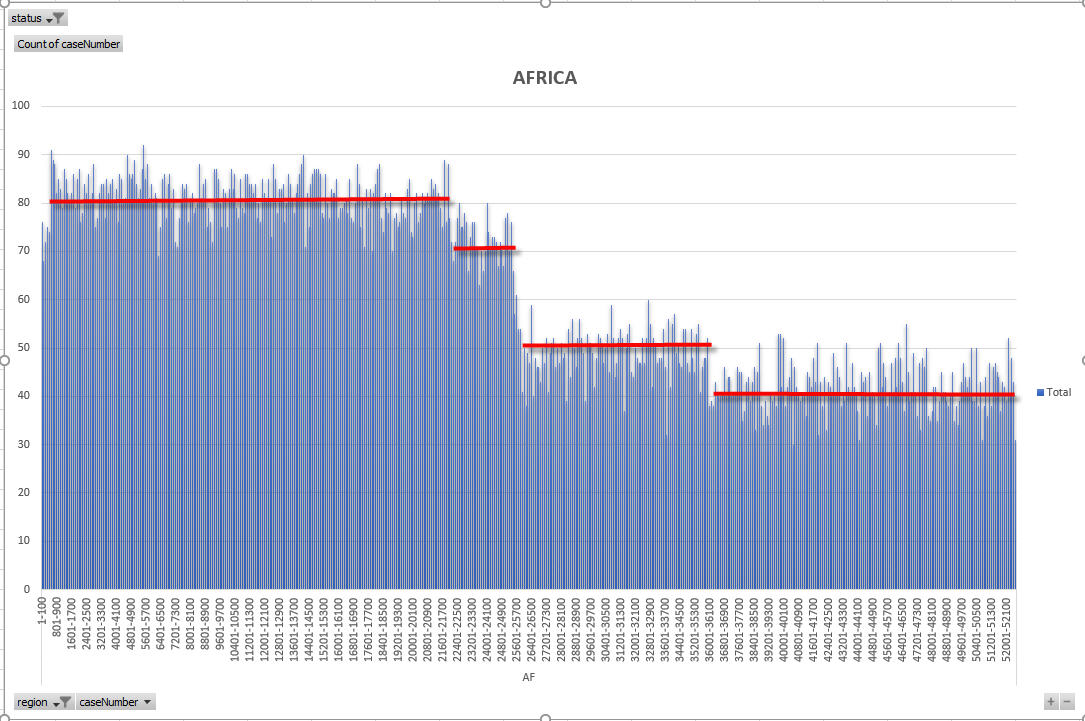
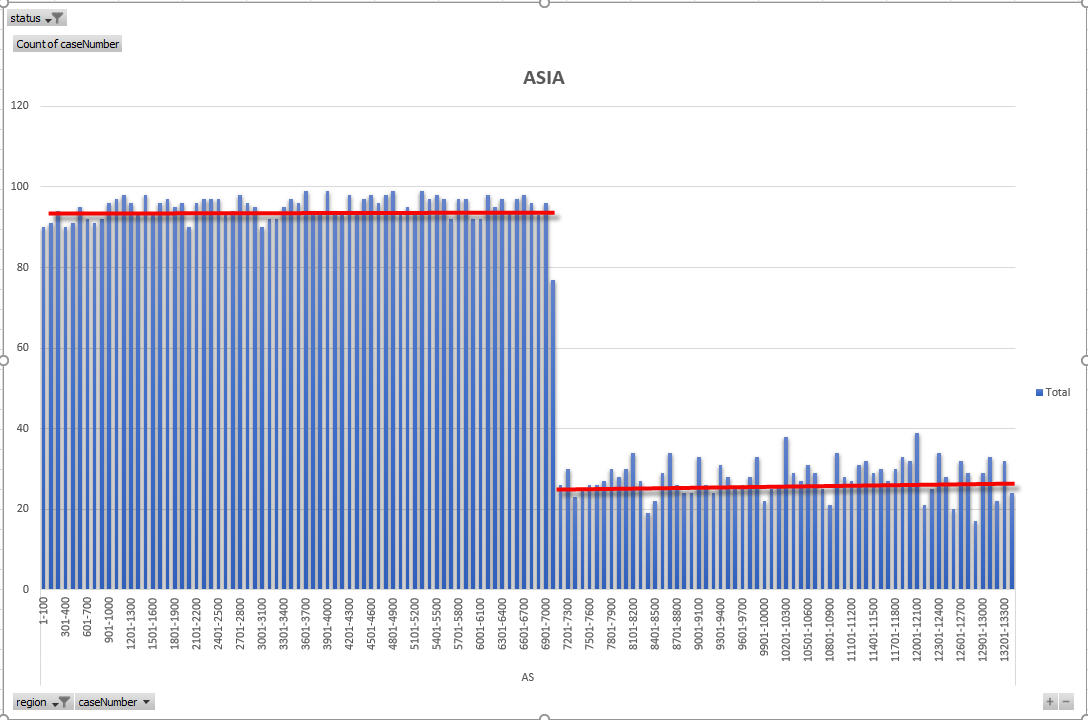
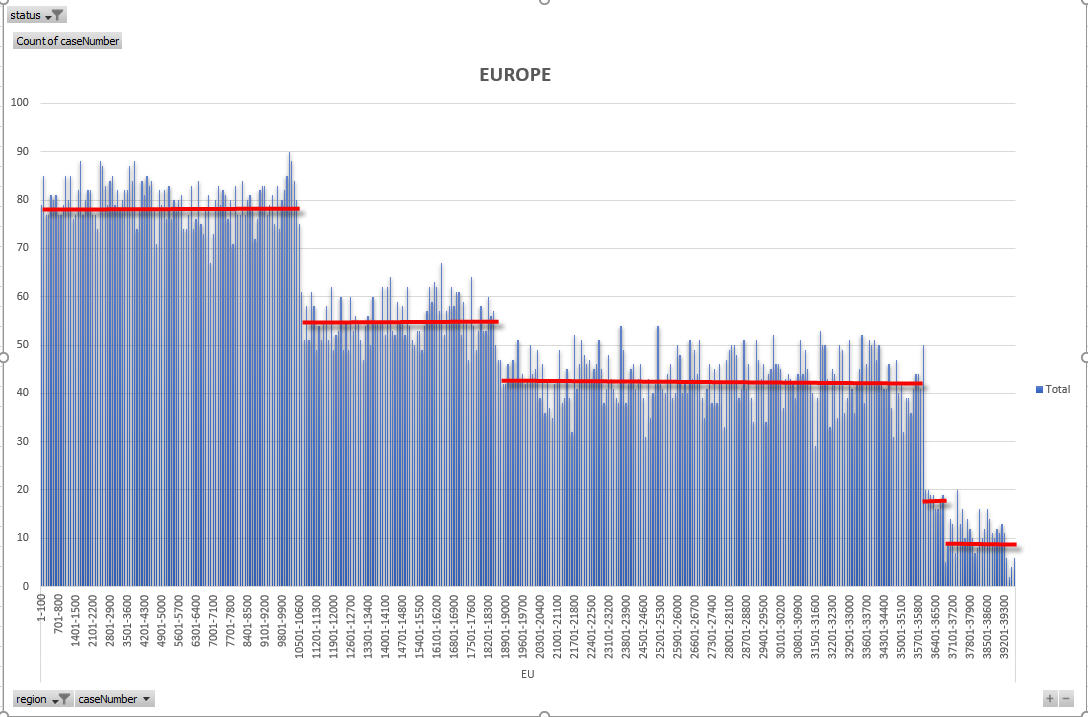
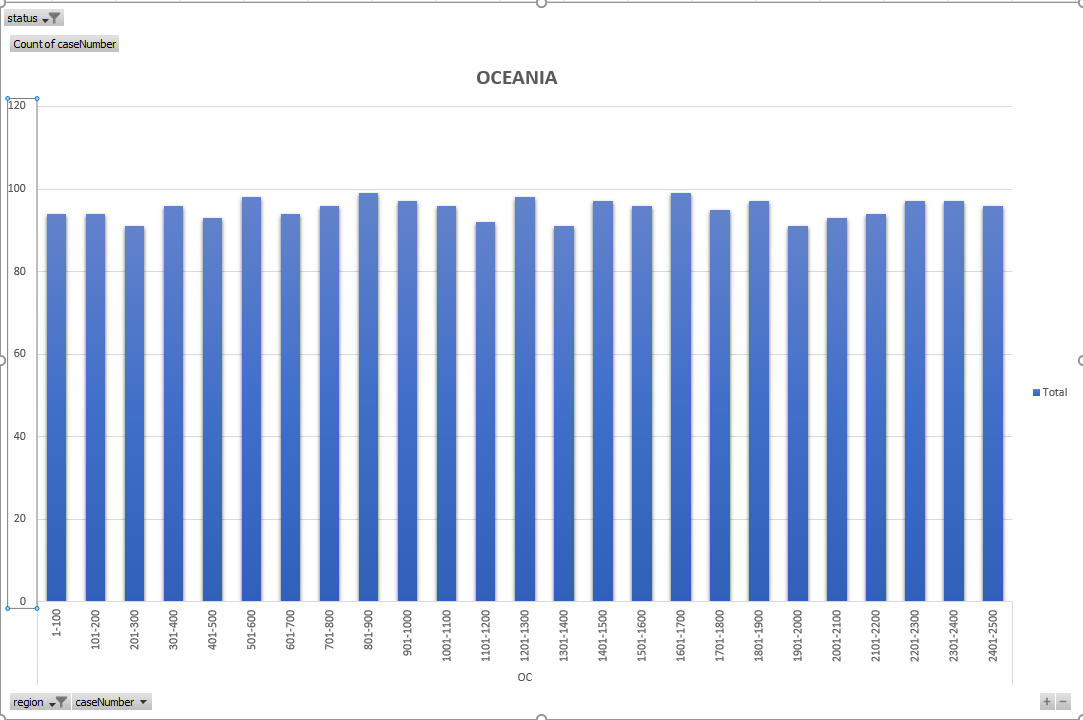
OK – so now I am going to show the density charts for each region and highlight on the charts when there are country limited density drops. The following charts all express density as the number of cases per 100 case numbers.
So – from the above charts and explanation you should be able to understand that because density decreases for the three large regions, those regions can see an acceleration of VB progress in later months of the DV year. I cannot pick exactly which countries cause which density drops in all regions, other than the very clear drop in Asia region which pinpoints the limitation of Nepal and Iran (at about 2018AS7100).
By the way, the file also gives us the maximum case numbers we have found in each region. Those case numbers are:
AF – 52581
EU – 39695
AS – 13396
OC – 2500
SA – 2457
There is a chance that there might be a few cases above our max case numbers. The scraper was programmed to assume the cutoff had been reached once it had found nothing but holes for over 100 numbers. So – if you have a case number higher than this data suggests, let me know.
Xarthisius has created a tool to present all this data in a very useful format. You can download the data in csv format, get nice graphs showing the counts of all the status types for each region, and each country. It really is a nice tool!
https://dvcharts.xarthisius.xyz/ceacFY18.html
As far as VB progress goes, as I have already detailed there is going to be a slightly increased acceleration over the numbers I had suggested in my VB progress explained post. That post was written (in early October) with a focus on EU region. Rather than the 2500 increase I saw for the March interviews, I think we will instead see something around 3500 increase (to about 14000/14400). Once the next density decrease is hit, progress can move faster still in later months. However, please read my earlier post to get a reminder about VB progress NOT being the perfect predictor for final cutoffs. That will take more analysis, and must consider response rate, issued rate, derivative growth rate and so on. EU is easier to predict because none of the countries are being restricted during the VB as they are in AF and AS region. AF and AS are NOT so easy to predict.
AF sees a number of density decreases which will each help accelerate VB progress BUT the restricted countries (Egypt and Ethiopia) make the calculation more difficult. Over the coming days we will see the next VB, and I will try and come up with predictions after that – at least in broad terms. I would like to hear from Egyptians to determine the max Egypt case numbers assigned. Egypt enjoys a high success rate and a high number of selectees, so it is possible that not all Egyptian cases will be interviewed, BUT I don’t know the max case number for Egypt so I have no way to guess where the cutoff might come.
For Asia, the travel ban is a BIG influence, BUT we really don’t know how KCC will handle the ban from this point forward NOR do we know whether the ban will stay in place. So – whilst we know that Nepal runs out of selectees by 7100, we can expect slow progress until that point. It is somewhat surprising that Nepal has so many selectees concentrated in the first 7100. That does make me think we will see a limit hit for Nepal at a lower than 7000. This is because of the 7% limit I mentioned earlier in the article. Like Egypt, Nepal enjoys a high success rate and a high number of selectees – so Nepalese cases above 6500 must be considered somewhat at risk.
So – it still remains a case of wait and see for a lot of people. I will spend some time on alaysis of the data in the coming days and will publish any findings. I hope this article has explained some things for you.
If you want more detail about the concepts discussed here, you can read these posts


January 8, 2018 at 15:41
hi brit, i’m dv winner 2018 case number AS32xx nepal and i’m f1 student i didnt choose interview in my home countery now what will be the next process plz
January 8, 2018 at 15:43
You had better pay attention to what you are doing.
Read the link below. STUDY the spreadsheet linked from the first post. Don’t ask questions on that thread UNTIL you have studied the spreadsheet in detail!
http://forums.immigration.com/threads/dv-2018-aos-only.336256/
January 9, 2018 at 08:56
Hi Brit pliz advise me am a Dv lottery winner interview due 30jan but my host is neither green card or a citizenship she is asylum seeker do I have to get another host .
January 9, 2018 at 15:02
Yes
January 12, 2018 at 10:33
Hi, I have an odd math question.
We’re trying to compare CEAC data against real (subjective) statistics.
https://travel.state.gov/content/travel/en/legal/visa-law0/visa-statistics/immigrant-visa-statistics/monthly-immigrant-visa-issuances.html
for example, for Russia reports 60+ DV visas for October and 105 DV visas for November. If we add all immigrant visas that will make ~200 for October and 250 for November, if you divide it by 20 (working days) the result will be :
Russian Embassy issues about 10-12 immigrant visas a day.
BUT people, that already got their visas approved report to see much bigger number of immigrant candidates, 30-50.
How can that be possibly explained?
January 12, 2018 at 15:18
Some candidates get refused or AP. Check the CEAC data.
January 12, 2018 at 15:53
Thank you.
But the amount of refused or AP visas are very low, if compared to issued visas.
for example 12 issued, 3 AP, 1 refused. 16 a day, does it look like a normal work process?
January 12, 2018 at 16:46
Yes.
January 14, 2018 at 10:21
Hi Simon,
Just want to let you know that im an Egyptian with case number AF58XX, i went for my interview on the 5th of December 2017, they asked me to fill in the DS-5535 and return it back by email. my visa was issued and i received my passport back on the 26th of December.
Thank you for all the help. Cheers.
January 14, 2018 at 16:00
Great!
January 17, 2018 at 13:57
Dear Brit
Thanks for everything.
I did amazing guess on ur post ” VB progress explained-again” . For EU for instance u put 2500 CN increase for Jan, Feb & March which will total 13500 (6000+2500+2500+2500) nearly equal to the march actual release 13800. & same true with AF…ur guess around 17500 ( cuz u said same as EU ) the actual is 17700…amazing!!!!!!!
when will u give us z next prediction of ur own as we have both z CEAC data & the March interview cut offs at hand?
Big thanks again!
January 17, 2018 at 15:21
Wait and see!
January 28, 2018 at 18:00
Hi Brit, I apologize for bothering you but I have not been able to work on the excel file because all the data come out in a column and I do not know how to separate them. the first time I downloaded it in Jan 03 came out all right.
January 28, 2018 at 18:10
https://britsimonsays.com/visa-bulletin-for-march-2018-interviews-released/comment-page-3/#comment-100642
January 28, 2018 at 22:20
Hi Brit, why some countries are not listed in xarthisius graphs? For example Belarus and Azerbaijan are not listed there. These countries have a high nr of selectee and will be interesting to compare nr of issued and refused visas.
January 28, 2018 at 23:59
All immigrant visas processing for residents of Belarus is done at the U.S. Embassy in Warsaw, Poland.
The U.S. Embassy in Tbilisi, Georgia processes immigrant visa applications for Azerbaijani citizens and other foreign nationals residing in Azerbaijan.
That’s from official pages of embassies in Belarus and Azerbaijan. Nevertheless, I checked if all codes in our db are accounted for. I found that we were actually missing 3 of them: Kingston, Jamaica; Pristina, Kosovo and Ho Chi Minh City, Vietnam which processed 1, 67 and 1 cases respectively for DV17 and DV18. I’ll add those charts during next release. I’ll add some code that will warn me should this happen again in the future
January 29, 2018 at 00:55
Thanks mate!
January 29, 2018 at 10:50
Thank you!
April 24, 2018 at 18:54
Hi Brit,
I was looking over the data that the DV community has so kindly scraped & compiled; is the high rejection/refusal rate for the AS region normal?
By “high” I mean higher than EU or AF. Percentages in the double digits is quite shocking. Is there a cause for this?
Do the refused visas get recycled into other regions?
Cheers,
Simon.
April 24, 2018 at 20:00
The travel ban has effected that. Yemenis and Iranians have high refusal rates. If the travel ban is not lifted, the whole of Asia will continue to take the visas required by demand. If there is a remaining surplus, that surplus can be distributed to other regions according to quota.
May 2, 2018 at 11:09
Hi brit, Would this mean AS13XXX would stand a chance of getting an interview?
May 2, 2018 at 13:24
Yes
May 2, 2018 at 21:08
Thank you Brit.
May 2, 2018 at 21:24
Hi Brit,
How can we know what quota each country has and whether the quota for each country has already been exceeded? For example what quota Nepal has and how many visas has been issued and how many remaining to be taken.
May 3, 2018 at 03:26
**NO country** has a quota. None.
There is a max limit of ANY country that effectively limits the visas to 3500 visas. Nepal have not reached that yet – check the data for exact numbers
https://dvcharts.xarthisius.xyz/ceacFY18.html
May 11, 2018 at 11:46
Hi
Brit , l am from Nepal and my sister is dv winner of 2018 and case no is 63×× . I think she will get second letter notification in may for july interview but only 425 members case no was drop still 50 no is remaining to reach her case no. What will be chance in june for interview august?? ? Will stop the process her becase of high case no and low possibility of getting second letter in june?.Please inform me what will be .
May 11, 2018 at 13:53
There are two months left. RELAX. Wait and see.
June 16, 2018 at 14:11
At this point it is already clear what irregularities in the graphs refer to. For Africa, that is Egypt (max AF21320 to AF21578), Ghana (max AF25410), Ethiopia (max AF25480), and a number of countries decreased in whole interval AF34638 to AF37147, we’ll see more precisely soon. For Asia, Iran (max AS7108) and Nepal (max AS7023 to AS7135). For Europe, Ukraine (max EU18465) and Uzbekistan (max EU10591). Irregularities above EU38000 refer not to one country, they refer to gradual decrease for several countries.
June 18, 2018 at 20:45
What do you mean for Egypt
June 18, 2018 at 10:47
Hi simon I recently submitted my ds-260 on 1 June for dv2019 my CN is AS1XXX and I just found out that I filled the wrong high school name I.e in certificate it’s written high secondary school and in ds260 I wrote college what should I do plz reply
June 18, 2018 at 14:06
Doesn’t matter.
July 12, 2018 at 20:10
Hi Sir
My case number is above 2019AS00011000 from Afghanistan
So when my interview will arrive???
July 12, 2018 at 20:25
At least 1 year from now.
July 29, 2018 at 18:27
Hi britsimon
Am Josphat from Kenya Africa am a selectee 2018 case number 49226 I went current from July have been waiting for my appointment letter but I haven’t received it yet the period is going to be over what could be the problem since am experiencing along wait.
July 29, 2018 at 20:54
Yes AF went current for August interviews but went backwards for September interview (the last month). So your number is too high and you won’t get an interview. There is no possible way.
July 30, 2018 at 08:02
This is just out of curiosity. Has any case that went current in previous month(s), but above cut off now in AF, and were fortunate enough to get an interview then received their visa(s)?
Thank you
July 30, 2018 at 14:09
That happened only for August interviews – so those interviews haven’t happened yet.
July 30, 2018 at 08:54
just been scheduled for interview under AF Region…Kenya for 7th sept 2018…brit what next?
July 30, 2018 at 14:11
Book your medical and prepare documents. Read the FAQ
July 31, 2018 at 09:26
Thanks Brit…
September 19, 2018 at 05:57
Thanks Brit….i wen through the interview succesfully and visa was approved and given to me…now planning to travel hopefull in the month of october…again thanks and God bless the works of your brain.
August 4, 2018 at 20:53
Hi Brit, a have a case nr 2018eu29*** , can you please tell some thing about it, is it over or i can still hope, thanx
August 4, 2018 at 21:19
It’s over. EU25775 was the final VB number
September 18, 2018 at 15:56
Hellow britsimo my case is AF32*** i have passed my interview in 30/8 he sayed to me approve but still ready in visa statut check is there a time limit for giving visas
September 18, 2018 at 16:56
No DV2018 case can be approved after 30/9/2018
October 4, 2018 at 03:15
Hi brit
My interview was in August 2018
My wife and my childrens issued and i still administrative processing my case number AS12*** . CAN i be issue after 30 September
October 4, 2018 at 03:24
No.
December 28, 2018 at 06:57
Hello Brit, this is Mena again 🙂
Is it an educated guess to think that the density drop for Africa around 24xxx to 27xxx is related to Egypt’s limit as the data from the Xarthisius website shows that the last issued Egyptian visas were in the 22xxx to the 23xxx range? And from that we can have a similar look at the 2019 data when it becomes available around the first week of 2019 to try to predict the cutoff and the safe numbers to Egypt?
Am I starting to understand more here or I am mistaken?
At anytime, if you think that my questions are “spammy” I will stop posting further comments. It is your website and I respect your decisions.
December 28, 2018 at 14:11
The density drops indicate limited countries like Egypt – that is correct. However, previous year have show several such drops and it is not always clear which one relates to which country. So – when we see 2019 data we will have a better idea, and by sampling data from other selectees we will build up a theory of where each country cutoff hits. I have written several detailed articles that explain this – please search for them and read if you are interested.