I am going to post a series of posts with analysis of the CEAC data – which will educate and inform those who are not used to the DV process.
As we should all know there are certain factors that determine how many of the selectees in each region can get their visa. Those factors are:-
- The global quota (we know this is around 50,000)
- The regional quotas (more in detail about that to follow)
- The number of chosen selectees (we know this to be about 92,000)
- The number of people that will want to process their case (we can guess this based on previous years).
- The success/refusal rate per country and region (we can guess this based on previous years).
- The density rate (this article will explain that)
- The derivative rate and rate of increase.
So – let me start explaining some of that.
Density
What do we mean by density?
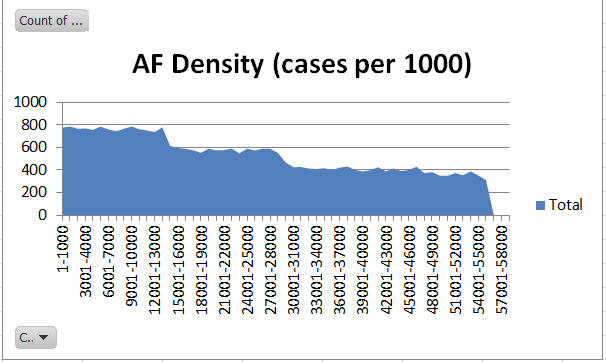
Each principal winner is assigned a case number and the derivatives of the case are attached to that case number. So – if we take a large region such as AF region we might expect that 30,000 cases would mean a highest case number of 30.000. However, that is not correct. This year for instance there are 30066 cases spread over 55951 case numbers. As I have explained before, there are holes (gaps) between the case numbers – so in fact there are nearly 26000 holes in the 55951 case numbers. Why is that? Well in Africa region around 23% of winning cases were disqualified before May 2015. Those winners were never informed of their win – they were disqualified because of some reason such as duplicate entries, bad photos or similar reasons.
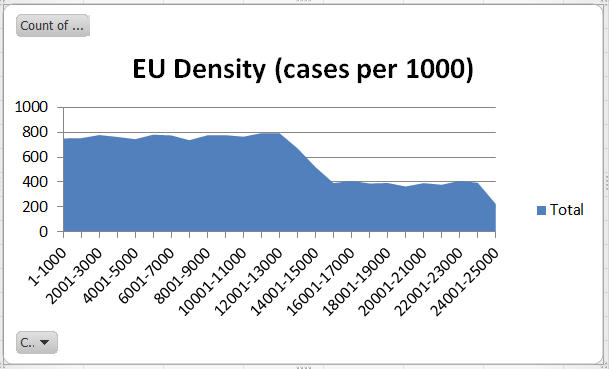
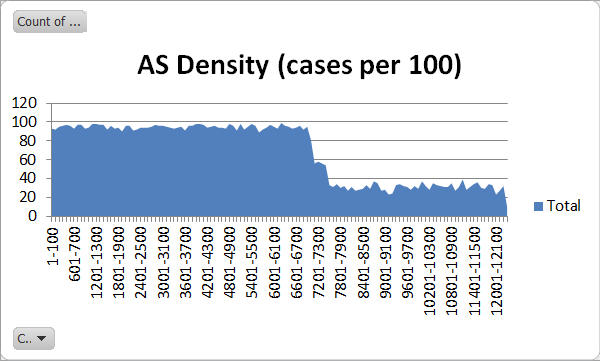
In addition to those cases, several countries were “limited”. This happens where a country has so many entries that they would have too many selectees. This is explained in this illustration from DV2015. Essentially if we had one country with 10,000 entries, and another with 1,000,000 entries then we would see the larger country getting 100 times more winners than the smaller country. To avoid this impacting the lottery in an unfair way, some high entry countries are limited. This is obvious when we look at the density charts for each region – we see a stepping down of density of cases per 1000 or per 100 case numbers.
So – let’s look at the density charts for the 5 main regions.
Africa
Note the initial 23% disqualification rate and then noticeable decreases (stepping down) at about 14000 and 28000 (most likely Ghana then Egypt).
Europe
Note the initial disqualification rate of about 23% and then density reduction between 13000 and 15000. These are the “U2” countries (Ukraine and Uzbekistan)
Asia
Asia has a low initial disqualification rate of around 5%, and then the two limited countries can be seen stopping at around 7100 (most likely Nepal) and 7500 (most likely Iran). We can deduce that in the early numbers (up to 7000), 40% of cases are from Nepal, 30% and Iranian, and 30% are from the resot of Asia (ROA).
South America
SA region does not have any limited countries – and has a small disqualification rate of around 5%.
Oceania
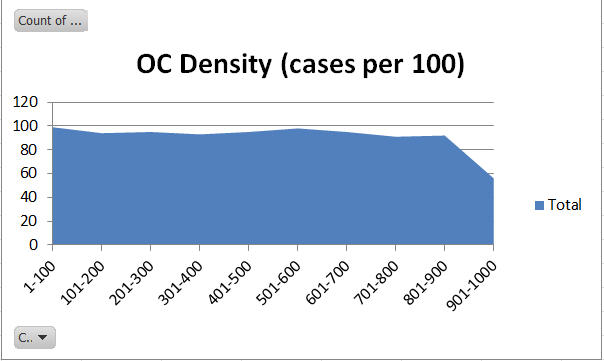
OC region also does not have limited countries and has a disqualification rate of around 5%.
OK – hope that makes sense – more to follow….
All the analysis posts.
Density
Derivative growth rate
Response Rate
Issued Rate and Predictions


January 2, 2016 at 05:16
“so in fact there are nearly 26000 holes in the 55951 case numbers.” . How did you know about that Mr.Simon?
January 2, 2016 at 06:36
Because I extracted the data and found there to be 30066 cases. I published the data today.
January 2, 2016 at 06:47
Because of high rate o disqualification early then decreased. This explain high current numbers in first few months then slow down. And because decrease of disqualified numbers. I think slow increase will remain for next 3 or 4 months. Am I right?
January 2, 2016 at 06:49
Sorry .I am talking about af region
January 2, 2016 at 06:56
No, you are completely wrong.
The high pace at the beginning was due to the backlog. I have explained that several times on my blog. The lower density and reduction of the backlog will increase the pace over the coming months.
January 2, 2016 at 07:32
What about Asia, I see it’s a good will be better than 2015
January 2, 2016 at 09:25
sorry Mr Brotsimon …my english is not good ..so too simply ..could we say that CN under 55900 will be current for sure?
January 2, 2016 at 16:17
NO!
My site can be translated into 90 different languages with the translate button. Use that.
January 2, 2016 at 11:06
What will be AS cutoff?
January 2, 2016 at 16:16
I don’t know.
January 2, 2016 at 23:10
Is there any way to guess cutoff numbers with data.im in AS region.whatz the use of this data?if there is a way how to do it.pls help.thanks in advanced.
January 3, 2016 at 03:12
Your number is SA2XX – right? Well that is too high to be considered safe, and not high enough to be a lost cause. You will have to wait and see. Predictions are not precise this far out.
January 2, 2016 at 19:18
Thank you for the useful information!
I am really surprised about EU this year… the pace hasn’t decreased at all and it seems that on july every case will be current. Probably there will be some EU wasted visas, don’t you think so?
January 2, 2016 at 19:22
Yes.
January 3, 2016 at 03:42
My number AS 82**. Asia.in your analysis u said nepal finish in 7000 and iran 7500.roa 30%.whatz that reflects.thanks for ur free service simon.really appreciate.
January 3, 2016 at 06:07
It reflects the number of entries by each country. Nepal and Iran have huge numbers of entries – so they get more winners.
January 3, 2016 at 06:26
Is it mean maximum nepal visas 3500 filled during 7000CN and iran visas 3500 filled in 7500CN approximately .then Roa 30% any predictions simon?
January 3, 2016 at 06:36
Im from nepal My case no is 4940 I read 2016 anylasis but can’t understand clearly so did I have probablety to get second letter or not?
Thanku
January 3, 2016 at 13:06
i urge u to look CEAC data. i analyzed that in average 1 case holds 2 derivatives. so. for one case 3 visa will issue. and, since nepal has 300 cases per 1000 case number tentatively, per 1000 case number, 900 visa will be issued. so, in this way upto 4000 3600 visa will be issued..
January 3, 2016 at 15:46
Your numbers are incorrect – and your conclusion is very wrong.
January 3, 2016 at 15:50
You are fine.
January 3, 2016 at 12:41
Any guess for asian cutoff.is it possible to use this data to determine cutoff numbers.saw ur analysis for asia.bit complecated.please help.thanks in advanced.my cn AS82**
January 3, 2016 at 15:47
Did you read my reply earlier where I said your number could not be predicted!
January 3, 2016 at 15:50
You have done analysis for asia.7500 until iran finish.that’s it right?
January 3, 2016 at 15:54
Dayan, please don’t ask me questions that are already clear. I have already explained why I cannot give you a certain answer on your number. You will know in JUly.
January 3, 2016 at 16:00
ok,i’ll wait and see all the data until July without analyzing .thanks for you help.
September 5, 2017 at 22:53
Did u get an interview
January 5, 2016 at 04:17
Hi Sir, you said there won’t be current for Asia,what does it mean?confused.
January 5, 2016 at 04:22
If the quota is firm (meaning AS does not get any visas from EU), then there are not enough visas for all who would want them in Asia.
January 5, 2016 at 11:44
Hello Sir you mean even not for Nepal.
January 5, 2016 at 18:03
Correct. Nepal does not get special treatment in any way…
January 5, 2016 at 22:05
In your density chart nepal is stopping at 7100 but one of my nepali friend whose cn is 84xx . Why Brit?
January 6, 2016 at 00:24
Bcoz when nepal filling other ROA also fillingin between.
January 6, 2016 at 00:30
There may be a very small number of individual Nepalese cases above the 7100, but those are either anomalies or they are not chargeable to Nepal. Sadly, they are extremely unlikely to become current.
January 10, 2016 at 04:54
Hy brit ny cn is 669x how many % i have chance to get 2nd letter? I n from nepal
January 10, 2016 at 06:35
You have some chance, and some risk. You have to wait and see….
January 10, 2016 at 13:44
Hi
Could u give me the probably cut off for Africa Area ??
January 10, 2016 at 15:33
Keep reading!
January 12, 2016 at 11:36
Dear sir,
You had explained that in density, Nepal is stop in 7100 and there is 40% from nepal.Total winner from nepali are 3801.But 40%of 7100= 2840. Remaining 1000=????
January 12, 2016 at 18:29
3801 includes derivatives – who dont have their own case number
January 18, 2016 at 10:14
Dear Brit Simon, I really appreciate your analysis help, so I don’t understand well what means by “disqualified before May 2015. Those winners were never informed of their win – they were disqualified because of some reason such as duplicate entries, bad photos or similar reasons.” thanks alot
January 18, 2016 at 15:34
I don’t know how to write that any simpler. Cases that were randomly picked but immediately disqualified.
January 19, 2016 at 06:19
Great, well understood.Thanks a lot !!!
October 20, 2016 at 04:54
dear simon!
i am 2017 selectee from nepal with case no. 70xx and have few questions.
1. there is a drop at 7100 from 95 to 58 and at 7500 from 58 to 35!! what does that mean??
2. based on recent trends could you please tell what is the holes percentage for asia this year?
3. how does holes affect a selectee with high case number from country like nepal?
4. could i presume that this year there are 40 percent nepalese, 30-30 from iran and roa at 7600 cutoff like the prev year?
5. approximately when will this year’s ceac data will publish?
thanks a lot
October 20, 2016 at 17:50
1. This is explained in the analysis posts. I don’t need to repeat it.
2. I would assume it is similar to last year.
3. See 1
4. Probably.
5. January – but I don’t have a way to extract it.
May 15, 2017 at 11:14
Dear BritSimon, your Blog is really a gem, thank you very much. 🙂 My wife and I will apply for the DV-2019: my wife was born in Austria and I was born in South Africa. Do you recommend – due to the better quota for Europe – that I should claim my spouse’s country of birth (i.e. Austria)? Many thanks in advance and BR Bernhard
May 15, 2017 at 13:11
You can safely do that, yes.
May 15, 2017 at 16:49
Many thanks, BritSimon and please keep the good service up.
September 12, 2017 at 19:13
Hi, mr. Simons.
I am selectee from EU region with number 33xxx.
If this pace continues for europe, should I expect the second letter and when?
When is more relevant for me at this moment.
What are your predictions about this?
Thanks on advance
September 12, 2017 at 20:26
You have months to wait.
https://britsimonsays.com/dv2018-basic-questions/
March 3, 2018 at 17:52
Between July if you are lucky, and… Never !
March 3, 2018 at 20:21
@Lionel, I am stunned that there are still people bitter enough to spread negative vibes on posts almost 6 month old.
Mind your own busines pall and let us positive ppl trust as little chance as we have!
March 3, 2018 at 21:11
If my answer is negative for you, that means that you are 100% sure that 33K will be reached, or that 33K can be interviewed before July. Really ?
March 3, 2018 at 21:14
I don’t write to be negative. I really hope you will be interviewed. Fingers crossed !
March 3, 2018 at 21:15
Maybe he just doesn’t need the negativity. Really.
March 3, 2018 at 21:20
that post was nearly 6 months old. Lionel, really?
March 3, 2018 at 22:06
don’t know why it scrolled here when I clicked on “recentcomments” -_-
March 4, 2018 at 00:14
Because you were looking at an old article, and that comment was the most recent comment on that article. Not really a mystery. The dates are shown on posts and articles.