I am very proud of the community of people we have here. As a community, there are people all over the world solving captchas for the benefit of all of us. I’m humbled and impressed to be connected to you all in that way.
It’s important that we finish the initial scrape of data as soon as possible. We want to get the data as a “point in time”. The initial results show for the first time what are the highest case numbers in each region, and show the holes that affect the “density” of cases within a region. Some people won’t understand what I mean by density, but I have explained this previously. For DV2016 I published a series of articles that explained that in detail. You can start to read those articles here. In simple terms though if you were case number 1000 in a given region, you might think there are 999 cases in front of you. That will not be the case, since there are “holes” which are case numbers without any real case attached. These are cases that were removed before the winners were announced, either because the cases were disqualified (duplicate entries, invalid country selections etc) or the country was stopped because there were already “enough” winners from that specific country. That makes more sense when you understand the draw process, which you can read about here.
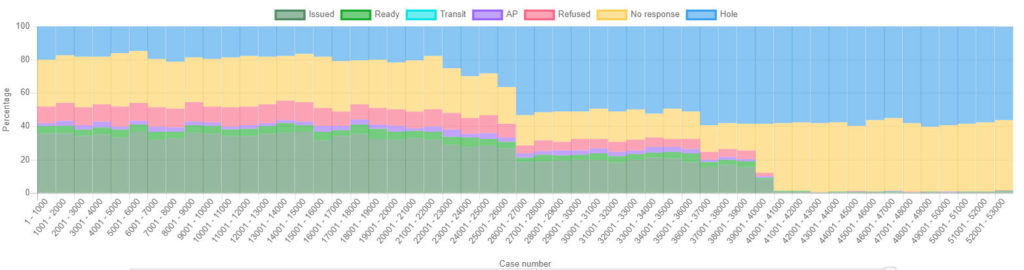
Now, as I mentioned in my last blog post I was hoping I would wake up this morning and find that AF region was completed. It is. So I am going to show you the chart from Xarthisius that shows all the cases for AF region. I will also show you the same view from DV2018 and DV2015 to show the differences. I have data going back several years, but the charts that Xarthisius has produced illustrate the data very well .
So – first of all, here is the chart for DV2019 AF region.

So – what does that show? Well first of all we can see there are no case numbers above 2019AF48XXX. So – if you have a number in that final range you now know you are at the back of the line. But another important finding is the holes. The holes are in blue on the graph above. You can see the holes rate starts at about 30 – 35% on average, meaning that each one thousand case numbers only has around 600 to 700 actual cases. The holes rate increases after about 20000, which happens as countries become “limited”. These countries are countries such as Ghana, Egypt, Ethiopia and DRC Congo. Remember I am talking about countries limited for SELECTEES – this does NOT necessarily mean they will be limited for visas to be issued.
Now, let’s look at the contrast with DV2018 and DV2015.
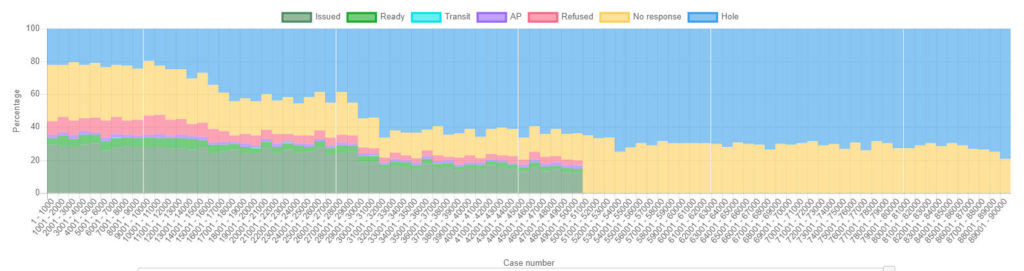
In the other charts (which are available on Xarthisius’ site along with the full data set for download) we can see that the starting holes rate in previous years was closer to 20%. That is the case for several years (DV2018, DV2017, DV2016, DV2015 and DV2014 at least). So – there has been a sudden increase in the holes rate. A sudden increase in cases disqualified before the winners were announced. That is very significant. I cannot be certain why that would be the case, but I can speculate the following possibilities:
- Increased information leading to better techniques to disqualify duplicate entries.
- Entries being disqualified for re-using photos from previous years (that was threatened/warned about in DV2018 but not implemented in DV2018).
- Possible targeting of entries from certain countries known for high levels of fraud (Ghana springs to mind).
As I said, I cannot be certain what happened, but it is clear that some different technique was used this year. Now – this does not affect you if you have a case number, you got through that initial screening, but it is interesting nonetheless.
The DV2019 chart also shows less obvious country drops. For example, in the other two examples you can more clearly identify sudden drops in real case density indicating a precise point where a country stopped getting selectees. That is harder to pinpoint on the DV2019 chart. There is a reduction starting at around case number 20000, but the reduction is more of a gentle slope toward the final density which shows around 60 to 65% of the case numbers are holes by the upper case number ranges.
The DV2019 data also shows the cases that have already been scheduled, or issuances. Once we have all the data we will be able to see those issued numbers and see how many cases are on AP, or get refused. All very valuable information.
As we get the same data for other regions we will know more about the density in general. I hope you can see how valuable this data is. Obviously the CEAC data is interesting to each individual case, but by looking at all the data together we can get some valuable insights.
Thanks once again to the scrapers – keep scraping!!! If you haven’t yet scraped many numbers, please use this update as encouragement to give us a few hours of your time.

January 5, 2019 at 16:06
Thank you
January 5, 2019 at 16:24
Slt. C’est mon premier commentaire ici, j’aimerais savoir si le fort taux de trou cette année est de bonne augure? Merci de me répondre
January 5, 2019 at 16:38
Questions should be posted in English.
January 5, 2019 at 16:57
This is my first comment here, I would like to know if the high rate of hole this year is auspicious? Thank you for answering me
January 5, 2019 at 18:06
Well yeah – that is what I just explained in the article above.
January 5, 2019 at 16:26
Im not very good in english ..but i have one question please…: what do you think about big cas numbers >40k…in afriqua ! Do we have a chance this year! My number is 2019AF43400
January 5, 2019 at 16:37
Once we have all the data we will do some analysis.
January 5, 2019 at 16:44
I want to do scraping but i never use computers any more…can we do it from ower phones !!!
January 5, 2019 at 18:03
It would depend on the abilities of your device. You can try.
January 5, 2019 at 16:29
Hi Simon.
Solved more than 2500 capchas. Hope you do the same analyse for Europe tomorrow.
January 5, 2019 at 16:36
Yeah, I hope so too. We need to get the data first though. Thanks for your effort!
January 5, 2019 at 16:47
Hey Brit,
I can read on the chart that for the 3000 being current every months on VB, approximately only 1000 selected are being issued, the second 1000 have no respond and the last 1000 correspond to the hole.
I still don’t get exactly what no repond means?
January 5, 2019 at 18:06
No response are Cases that are not scheduled yet because they are:
1. Not yet current
OR
2: Have not submitted their DS260 or supporting documents.
Some cases will never respond, others will, but later.
January 5, 2019 at 16:48
Interesting! Now I’m curious to see what the other regions look like, as well. Thanks for the behind the scenes work to both you and Xarthisius.
January 5, 2019 at 17:05
Thanks you for this work Brit.
My CN is AF46***, when can i have my interview?
I don’t speak english very well, please forgive my mistakes.
January 5, 2019 at 18:07
Well you can now see you are at the back of a long line – so you will have to wait and see.
January 6, 2019 at 01:50
What about AF45xxx. Also back of the line ?
January 6, 2019 at 03:57
Yes
January 5, 2019 at 17:41
Please Simon Is No. EF Egypt 17550 a large number or small and can come soon or not
January 5, 2019 at 18:08
It’s fine. Just be patience (and solve some capthchas!)
January 5, 2019 at 17:46
There is an user Anatemo on belorussian site, He already have some data about EU. Why Xarintius argue with him???
January 5, 2019 at 18:08
I don’t know. What data does he say he has? Got a link?
January 5, 2019 at 19:40
http://green-card.md/community/forum/messages/forum33/topic10346/message469766/#message469766
Simon See comment #1224
Don’t show my comment.
January 5, 2019 at 18:16
INFO ON 5.01.19
TOTAL CASES: 15170
Max Case Nr.: 2019EU30717
.
January 5, 2019 at 23:28
Briit where are you??????
January 6, 2019 at 01:32
Calm down.
January 5, 2019 at 18:31
MENA who are you? 6074:) take a rest:))) i did 758 and need a beer for today:)))
January 5, 2019 at 22:53
LOL
January 5, 2019 at 19:44
Hi brits
My CN is 2019AF318## do you think that my cn is big, is there a chance to pass the interview ?
Thank you very much
Simou
January 5, 2019 at 22:45
Yes
January 5, 2019 at 19:55
After checking these data I see my number is secure even if is high af281xx I counted there too much holes ahead my CN .soon or later I ll get interview early in summer.thx for your works that s great
January 5, 2019 at 20:09
Hi Simon.
For EU from 1 to 3000 there are a lot of numbers At NVC.
My question is:
Are they waiting for an interview or are they burned ?
Thank you.
January 5, 2019 at 22:45
Some will interview later, some never will.
January 5, 2019 at 21:27
hi everyone,
please somebody can explain what this number AF38425 does mean ?
it’s up to this average they Will schedule or not?because i won with af45xxx
January 5, 2019 at 22:44
Your question is unclear – why are you asking about that number?
January 6, 2019 at 00:40
because the highest number for Africa is this case
January 6, 2019 at 01:33
You are confusing case numbers with people.
January 5, 2019 at 22:56
Dear BritSimon
Thank you for all you do. I followed all your posts and everything went well with my interview and I got my visa.
Thank you once again. Be blessed
January 6, 2019 at 01:31
Congratulations!
February 10, 2019 at 07:17
Hi Florence,
Would you please share your experience. When did you receive the letter to request for supporting documents. Then , when did your receive the notification for the interview. Thanks
January 5, 2019 at 23:27
hi briit !!i see Antemo forum for europe 15170 cases cn max is 30717 europa… can you told something about this??
January 6, 2019 at 01:32
What do you want me to say??
January 6, 2019 at 00:01
hmm low density in Africa will cause increasing of chances of other regions,that’s excellent
January 6, 2019 at 01:32
Huh?
January 6, 2019 at 05:08
that anathemo guy is full of shit ,he provided help then he wants to pr his self ,and beeng mad about deliting his donation link,it will be kind of funny if it wasnt so sad.bro u are full of shit,if u dicided to provide help then just do ur job,or when u giving coins to poor man in the street then u trying to wrote ur bts donat link on his head?idiot.
January 6, 2019 at 06:34
wth thes mad lad, im gessing ure heving a bed day. stop beeng dick,
its so funey to read yuor coments, but plz Tell me thet you re not mad to Mr.Simon
bicause he’s our guardien Angel to us
January 6, 2019 at 14:49
I think there’s been a lot of misunderstanding there. I just wished they come forward beforehand with their plans, instead of doing what they did. In any case, there’s no need to be rude.
January 6, 2019 at 14:53
Hello xarthius!!when you post something for EU???
January 6, 2019 at 15:08
Exactly. I’m not thrilled about the way they behaved, but we can remain civil.
January 6, 2019 at 15:14
When you can give your predictions?
January 6, 2019 at 08:35
Hi Brit,
1. My case number is AF46*** (Kenya). Do you think the number is too high to get scheduled
2. When do you approximately think Africa will go current?
January 6, 2019 at 15:11
Now we have the data, we can compare to last year. Patience.
January 6, 2019 at 09:58
is it we can say this year, the winners whom recieved the email to send the required documents (pasport, birth cert and police cert) have not disqualified yet?? Because it shows that as their ds 260 has been processed.
January 6, 2019 at 15:12
KCC does not disqualify ANY case. Cases are disqualified before the winners announcement, or by the embassy (refused).
January 17, 2019 at 09:06
But travel ban for some countries was after announcement so who will disqualifed selctee from thos countires or they will go to intervoew any way
January 17, 2019 at 14:32
Those people can interview anyway.
January 6, 2019 at 10:09
hey brit,
We are still scraping. Current CEAC EU number is 29k. What do you think about EU ?
Best Wishes
January 6, 2019 at 15:13
Give me some time.
January 6, 2019 at 13:14
hi Brit,
we finished all case number what do you think about EU case numbers? Holes?
Best Wishes
January 6, 2019 at 13:54
we are waiting for europe…
January 7, 2019 at 02:03
>That is harder to pinpoint on the DV2019 chart
Not really harder. About the same as in DV2018. Still four clearly identifiable limits.
January 8, 2019 at 11:31
Hi brits
My CN is 2019AS49** do you think that my cn is big, is there a chance to pass the interview ?
I am from NEPAL…
Thank you very much
RISHAV
January 8, 2019 at 14:44
You are fine.
January 9, 2019 at 12:27
hi brit my cn is AF44xxx is there a chance for 2nd NL plz ?
January 9, 2019 at 17:15
Probably – read my latest article.
January 11, 2019 at 09:05
Hi BritSimon
The 2NL did not come to Ethiopia for CN released 2019Af00009800–2019AF0001800 to January and February despite the additional documents required was mailed back in due time.In my case almost before a month.The KCC confirmed receiving the documents. The 2ND news lettedfor CN stated above is expexted but too late .Why?
January 11, 2019 at 15:14
I don’t know. Be patient.
January 15, 2019 at 08:28
hi BritSimon,take my appreciation
mycn af24xxx,what do you think probably for 2nd NL in June?
January 15, 2019 at 15:19
2NLs are sent before interview dates. They are booking March interviews now, you might interview in May – but wait and see.
January 16, 2019 at 20:18
@britsimon; u have become optimistic on this. Interesting though! If this happens(9000 case numbers just in 2 months), AF region will go current around aug/sep.
Since z procedure is new and we know little about it, anything can happen.
My smart anticipation other than “Wait and see” ranges from being current for all regions in April at its best.. to termination of the program at all to the worst. Lol. I’ll opt the first.
January 16, 2019 at 20:42
If you fall of a tall building you might fall very fast, but at some point you suddenly stop. That is to do with the height of the building, not the speed of the fall.
January 15, 2019 at 20:22
Hello Mr Brit
Is it possible to know specific CN status?
AF18***
January 15, 2019 at 21:20
It’s obvious for that case. Waiting.
If you want more detailed info about whether your documents are processed, you can email KCC.
January 18, 2019 at 10:50
HI simon
i have submitted all required document but did not receive any feedback or my 2LNs and i am current january interview. my number is AF12***. they said that my ds260 have been process.
i would like to know if it will affect me in feb if i am not reveiving the second letter this month
January 18, 2019 at 15:01
1. The month is not over yet, more 2NLs will go out.
2. If you don’t get a 2NL this month, maybe you would be next month.
3. Check with KCC that they processed your documents.
January 28, 2019 at 08:16
Hi brit do you think that AF region all number will be scheduler? I’m about AF392##
January 28, 2019 at 14:11
Wait and see.
March 6, 2019 at 19:32
Hi Mr Simon
My cn#2019266xx, when will I be schedule for interview.
March 7, 2019 at 00:03
I don’t know. Wait and see.
March 10, 2019 at 20:54
Hi Brit’s. Thanks for your blogs really dear. I was ready for April, but haven’t been scheduled. My question is, please is it cause a problem if I didn’t scrape 2nl for April? I mean I don’t know how to do it please. But I didn’t see my CN on the chart of ceac data for April. But KCC confirmed my documents one month ago. Is this cause any problem if I don’t scrape please? I just look at my status on the site I checked the results. Thanks for answering dear.
March 10, 2019 at 21:11
Whether you scrape or not has no affect on when you are scheduled.
March 10, 2019 at 21:12
Alright. Thanks sir!!
March 11, 2019 at 05:38
Hi
I jst had a question…my son he has turned 21 so he was removed from the dvlottery program…so I wanted to know if he applies for a tourist Visa…his tourist Visa will not be rejected jst because his 21 and was removed for the dvlottery program….
Thank u
March 11, 2019 at 13:23
That could be a factor. They will also ask him about ties to his home country. If he cannot satisfy them that he won’t overstay, then they could refuse him.
August 21, 2019 at 10:38
Hello Britsemon wat to do my interview is tommorow 22 aug n my biometric is on 23 aug.wat to do?
August 22, 2019 at 03:51
At this point just attend both appointments.