We all know that there is a global quota of 50,000 visas available (up to 55,000 with the NACARA visas), but what has been more mysterious has been the split between the regions. Not understanding the regional split, has led many of us to make bad assumptions and estimations. I have read several times that the regional quotas will be published, but up to now have never found them anywhere, for any year.
However the split isn’t random, it is based on a formula described in the Immigration and Nationality Act (Section 203(c)) . Essentially is uses regional population data and previous immigration data to determine where the diversity visas should be apportioned -the goal being diversity. NOw, I have read tried to read the formula several times but each time I find myself falling asleep before I fully understand. It needed someone who was less likely to fall asleep and also prepared to go and research the population and immigration data. Luckily an insomniac hero appeared in the form of “DV4Roger”.
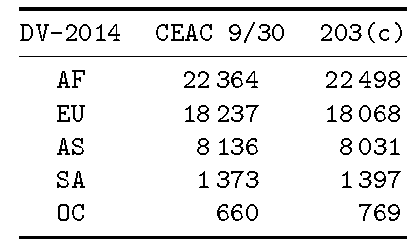
He used data from I pulled the data from dhs and census data which are sources the government may use and he modeled their formula. First he presented how his estimates would have predicted the DV2014 outcome (with a known final global Consular Processing quota of 50770). The table below shows his numbers against the final CEAC extract. The result is impressively accurate. The biggest “miss” is for OC region but the relatively recently introduced E3 visa could be causing more AoS cases, so I think that miss can be explained.

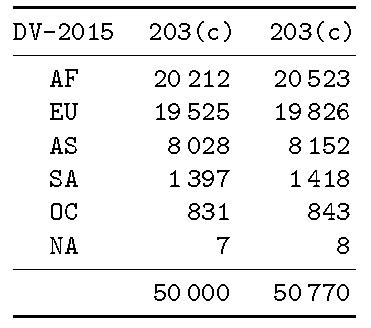
Next, DV4Roger applied his method to DV2015 using updated data. His estimates are shown below – the differences including the removal of Nigeria from the process. AS we can see his prediction is for a substantial increase for EU region, and a small increase for AS, SA and OC. AF would pay the price of these changes with a lower allocation – but again, Nigeria being out means the remaining AF countries actually have a small increase in visa availability per country.
Many thanks to DV4Roger for sharing his information. I tend to believe these are an accurate indication and will allow us to predict VB movement, particularly during the last month or two of the year.
Source: DV4Roger post
Note: DV4Roger has pointed out that there may be some mistakes in his numbers. So these numbers may be adjusted…


May 2, 2015 at 08:44
Fantastic website BritSimon, so cool that you’ve made this. Great work on the regional quota data here. We talked a little while back on the 2014 DV Australian winners forum (I didn’t get through in the end). You wouldn’t happen to know why there were so many more OC selectees that year compared to DV-2013 would you? From memory it was like a 50% jump and the first time in ages OC didn’t go current.
May 2, 2015 at 18:32
Hi typo,
Glad to speak again. We never did get clear proof why they increased the selectees so much from 2013 to 2014. It is almost as overselected in 2015 too. So – in a few days time we wil know if this is the new normal or not.
My best guess about why they did it was as a reaction to the 2012 “screwup”. Having extra selectees means they won’t leave thousands of visas left unused as they did in 2012. But – it is a brutal way to ensure that result.
May 3, 2015 at 00:19
Yeah it really is, especially for people who it could really make a difference for. I think I agree with you, maybe 2012 something to do with it, I’m especially curious though about the percentage increase that year for OC and SA, why it was so much greater than the percentage increase for the other regions. I think we have grip on the regional visa quotas now with your post, but the selectee quotas still maybe a bit mysterious?
May 3, 2015 at 04:48
Yes the increase in OC selectee count from 2013 to 2014 was crazy – it really made no sense…
May 4, 2015 at 13:06
Okay, glad I’m not the only one who thought that. Well enjoy the next few days, imagine it’s a busy time for you, how exciting it is going to be for some people, and what an up and down ride it is going to be for others.
May 31, 2015 at 14:09
Did DV4Roger send updated calculations? What kind of mistake did he find in his calculations?
May 31, 2015 at 15:44
There was a small adjustment, not significant.
May 5, 2017 at 12:37
Well, you are right – that USCIS formula put me to sleep every time I tried to read it. Do you have the formula/model (with explanation on the variables used) that DV4Roger came up with, hopefully in the form of a spreadsheet that I can reuse for future DVs’ regional quotas based on DHS and Census data in the future? I’ve read the link to his post, and subsequently his website, but could not find the detailed formula that DV4Roger came up with.His website doesn’t seem to be active anymore.
May 5, 2017 at 16:10
I don’t have the link for that.