People are often confused about how the case numbers are assigned and where they are in “the list” to get one of the elusive 50,000 Green Cards. To answer that properly it is worth explaining the lottery process itself.
There is an entry period of around one month, typically in October of each year. During that time people from all over the world will enter as there is no cost to entering the lottery and it is a pretty simple process.
Between the end of the entry period and the announcement in the following May, the “winners” and (selectees) are chosen. The process is like this.
Entries are sorted into their respective regions, Africa, Europe, Asia, South America and Oceania. The rules say that there should be an equal chance of winning within each region. There is a target of the number of selectees that will be chosen. The actual chance at this point is affected therefore by the number of entries a given region receives, compare to the number of selectees that will be picked for the first stage.
So – let’s look at some examples.
Let’s say that Africa receives 5 million entries (each entry can be for a single person or can include derivatives). It might be decided to pick 100,000 entries for the initial stage. That would mean a 2% chance of getting to that stage (100,000/5,000,000*100). Another region might have a higher percentage chance of winning per entry but get far fewer entries.
This is probably best explained by looking at some real data from 2013. The reason to use 2013 data is because that is the latest year that we currently have complete data – both entries and selectees.
So – first of all take a look at how many entries each country in the OC region had. I used official entry data and official selectee data.
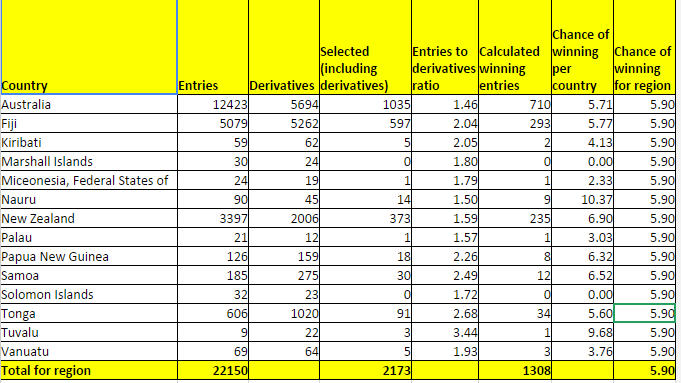
Because the published selectee data includes derivatives (family members) I use a formula to calculate the family selectees and then use that to calculate how many cases were picked from the entries (because the lottery is per entry, not per derivative).
OK so now we can see that in 2013 the region as a whole enjoyed a 5.9% chance of winning a place as a selectee. I have shown the resulting chances per country but as I stated before the actual chance of winning is the same across the whole region (mandated by law). There are variations of course such as Nauru which appears to have had a winning chance of greater than 10%. However, what really happened is just coincidental – they seem to have got 9 cases selected, rather than the 5 cases they would have expected. That is due to the nature of a random draw – nothing to get worked up about!
OK, how about a larger region for the same year – let’s take AF region.
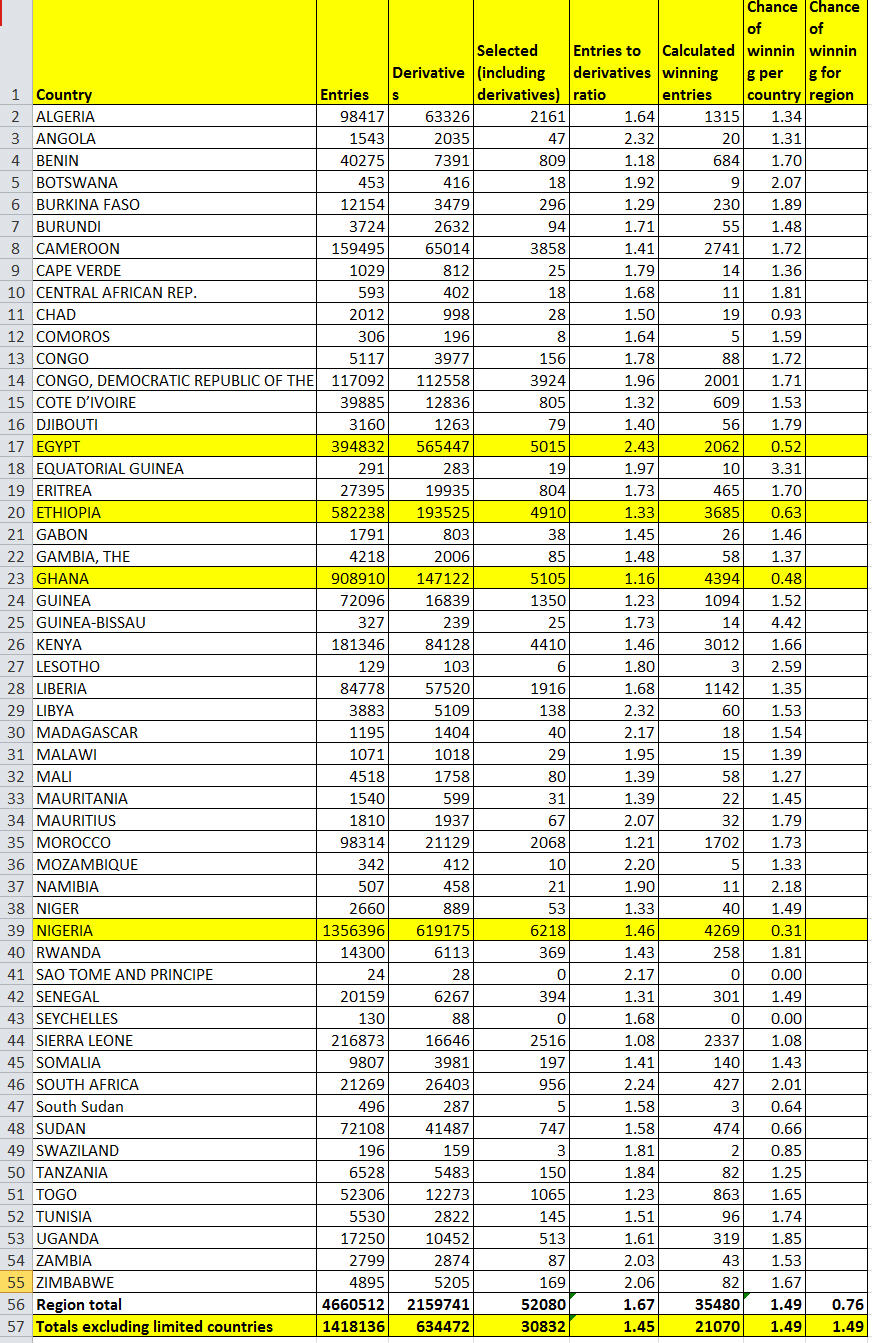
Now there is something to get excited about! I have highlighted four countries than have unusually low winning chances and enormous number of entries. If the draw is “fair” then Nigeria (which has 1.35 million entries!) should have around 13 times the number of winners than Algeria (with about 100k entries). They don’t – so what is going on?
Well the answer is that during the draw process, an artificial limit is imposed (in some way) on the four countries who would otherwise have received a huge portion of the overall selectee count. The last line shows that the four limited countries had 70% of the entries for the region but only received 40% of the selectees. So – they are being limited, for sure. In DV2013 and DV2014 this limit was around 6000 selectees per country (including family). In DV2015 they have lowered the limit to 5000.
So what impact does that limiting have on the process?
Well for applicants from the limited countries it means they have a lot less chance of being selected than people in other countries within the region. I cannot find where that result is supported by law, but I suppose the justification would be the 7% country limit. However, only one country (Nepal) has a realistic chance (high probability in actual fact) of hitting the 7% limit with 5000 selectees in DV2015. The four limited African countries were unable to hit the 7% limit even with >6000 selectees in DV2013 and DV2014 due to low response and success rates.
In addition the strategy of limiting countries creates holes and a concentration of selectees from the limited countries to the lower case numbers. To understand why, it is helpful to understand the draw process.
How is the draw performed.
The draw itself is a multi step process – the steps being:-
- Separate the entries into their regions
- A computer randomly orders every case for each region, assigning a region specific rank number (case number). This would start at 1 for the highest ranked entry and continue right down to the very last entry (which is why we have leading zeros on our case numbers). So a number could be be like 2015AF00021123. The numbers are consecutive at this point, with no gaps between case numbers. The numbering is region specific so just as my example if for an AF number, that same number could exist in different regions (for example 2015EU00021123, and 2015AS00021123). Remember, each case represents a single selectee and their derivatives.
- Next there are steps applied to identify and remove fraudulent entries. This is done by photo biometric matching processes, database searches on the names and other information within the entries. Those entries removed create gaps or “holes” in the numbers. These holes are randomly distributed throughout the number range. We often discuss the “density” of the cases versus holes. If a lot of fraud within a region, then the density of the cases will be low.
- The next step is to decide the selectees that will be notified. A computer process takes the entries in rank number order, keeping a count for each country as well as an overall count. There seems to be a count on the individual selectees and also one on the derivatives for each selected case. At some point a country will reach a point where it will be limited. From that point onward the process will knock out further entries for that country. Again this produces holes after the point that a country maxes out, and of course, this means the density of real cases will be lower in higher case number ranges (at least in AS, EU and AF regions which each have limited countries).
- Once enough selectees are chosen for the region, the selection process stops and they are ready to notify the selectees.
The above steps have been deduced from reading publicly available information and also apply a bit of common sense.
I hope than de-mystifies the process somewhat.
Update July 12, 2019 – I am including a link for this video that explains that process in a simplified way.
The data shown above is available for download here.

August 18, 2019 at 03:58
Hi Mr. Brit
I am sorry for bothering you…my case no is 5900. i am from Nepal, when i will get 2nl ?
plz reply.
August 18, 2019 at 04:29
A few months. Be patient.
August 18, 2019 at 03:59
year 2020
August 31, 2019 at 10:27
I am dv 2019AF0035*** send the required documents on may 21 and they said my documents were received late during the time of processing and when I call the Kentucky they say they did not recive them what might be the problem
August 31, 2019 at 15:18
Well I don’t know why they did not receive them, but you should have checked earlier. You have now lost you chance, there is no way to get an interview now.
October 17, 2019 at 17:43
Hello sir I entered the dvlottery 2021 but am scared my photo got may have and issue and also I was once selected for the dvlottery 2016 but an agent asked too much and I couldn’t afford it so I lost it. Sir can u take look at the picture sir ????
October 17, 2019 at 20:15
No. Wait and see if you are selected.
November 13, 2019 at 13:04
Good Brit,
Thank you for your clarification in most of the questions asked by different peoples,
I have a quick one;
1. I did fill my DS-260 using a passport that will expire next year August, in the meantime I did applied for a new passport which I will probably get early next year, will that affect any of the process? regarding that the passport number of the new will differ to the one I did use while filling my DS-260?
2. My case number is 2020AF00017XXX, when will I probably receive 2NL, considering that I just submitted my DS-260 2 days ago?
THANK YOU FOR YOUR ASSISTANCE.
November 13, 2019 at 23:14
1. No problem.
2. The will ask for documents soon. Then 2NL in late 2019 or early 2020.
November 14, 2019 at 07:12
Thank you Brit.
November 16, 2019 at 18:20
Hi Brit!
Thank you for your hard work, you can not imagine how much your videos and articles are such a helpful tool.
Unfortunately for some of us, we only find out about you 2 days after submitting the DS260??♂️
So yesterday I spent the all day reading your articles and watching videos.
I realized that I made some silly mistakes??♂️??♂️??♂️ on the addresses and some dates (like when I started leaving here and there… or studying…).
So after watching a video on unlocking the DS 260, I decided to unlock the DS260.
I then used the same format/template in the video and sent an email to Kcc to unlock my DS260.
Here are my preoccupation.
1. I have to change the address of my sponsor (I 134), is there any problem if I do change it?
2. To change the passport number I used while filling the DS260; I just realized that those passport are not currently used in my country. ( according to what I knew, if the passport(old) is valid you can still use it until you change to the new one), my old passport will expire in August 2020.
Thank God I will get my new passport soon.
Will that create a problem? As I want to change the passport number when it out on my DS260.
(I Am currently not leaving in my country of origin for the last 12 years).
3. To rectify some addresses for where I was leaving while in my country, and years about when I finished some of my qualifications. Will this create problem?
All the other informations are accurate.
My case number is AF17XXX, according to your predictions it should be current in January/ February.
Thank you for your understanding and your help will really be appreciated.
November 16, 2019 at 18:58
1. No problem. Just understand that the person whose address you give in the DS260 is not always the same person that would complete an I-134 for you. The address in the DS260 is where you want the GC to be sent once you enter the USA.
2. You can update the DS260 if you want, or simply take the old and new passports to the interview.
3. No
November 16, 2019 at 20:53
Once again thank you so much.
Now my fears are going down.
I will only rectify the dates and addresses, the rest am not going to touch them.
Hope they will open my DS260 soon so I can do those modifications.
June 21, 2020 at 09:43
Good morning sir,
Your space is of significant helpful to us.
I humbly want to ask if you could please tell the implication of answering “no” to “is your spouse immigrating to the US with you?” question on the DS 260 form.
2. Could it be possible for the spouse to join the partner after sometime, say after a year or two?
Kind regards,
June 21, 2020 at 19:03
1. Just means they won’t be included in the process.
2. Yes. It takes around 2 years, and is more costly & complex.
June 21, 2020 at 23:05
Grateful for your time sir. Got it now.
June 8, 2020 at 08:11
Hey Brit am Isaac i have checked for my results of 2021 on june 7th east african time 12pm and my entry has not been selected. Should i loose hope or i just keep checking until 30th september
June 8, 2020 at 15:57
In some years (not all) there is a second small release of winners, so check again in November.
July 11, 2020 at 00:33
I am trying to fill DS-260. What is “Electronic Diversity Visa Confirmation Number?
I put my case number, did’t work.
Thank you
July 11, 2020 at 01:50
Sorry, I find out what number they are asking for. Thanks
July 11, 2020 at 02:11
Well done.
August 23, 2020 at 09:24
Hello Brit
Are visas of derivatives counted amongst the 55000 visas?
August 23, 2020 at 21:01
Yes
January 6, 2021 at 22:29
What do mean when you say some countries in the African region have been capped? My case NUM is 2021AF714** how many people are before me?
January 7, 2021 at 19:33
It’s explained in my video above. Some countries get more winners than can be processed, so no further cases are chosen from those countries.
January 7, 2021 at 19:48
Okay thanks 4 responding, one more question: how many people are ahead of me looking at my case number 2021AF714**3
January 7, 2021 at 20:07
You can check here:
https://dvcharts.xarthisius.xyz/ceacFY21.html
January 25, 2021 at 08:42
Mr. Brit, the route to chek how many people ahead of you on the given link is not accurate,I entered my case number and its says its a hole…All numbers i entered are said to holes.
What does a 47 percent hole rate mean anyway..
Thanks
January 25, 2021 at 14:00
Remove the leading zeros!
January 25, 2021 at 21:33
Thanks a lot. It works. I saw the cases before me. God bless you lots.
Am 2021AF00025XXX . it shows that i have 13,000 cases before me.
May 26, 2021 at 10:02
Good morning
I ask you what the At NCV mean (statut submitted date)
May 27, 2021 at 05:24
It’s in the FAQ.
June 23, 2021 at 16:39
Hi Simon
I am a 2022 winner my number is 33XXX, I found someone of my country “EGY” his number is 6XXX do you have any explanation for that ? on the same page it seems I will have the interview on Sep 2022 !!!
June 23, 2021 at 18:54
Hi Mahmoud,
on what page did you see that your interview is likely to be in Sept 2022?
June 24, 2021 at 04:49
A DV2021 case obviously.
July 12, 2021 at 07:55
Hi BritSimon.
I checked in with the dvcharts website and my case number entered into their interface is described as “a hole”
I read through your FAQ’s but can you punish me with an answer… does “your case number is a hole” mean we’ve been overlooked for DV2021?
July 13, 2021 at 05:10
No, it means you didn’t read/follow the instructions on that site.
August 11, 2021 at 13:17
From the video explanation, does it mean the case numbers are assigned according to the day one applied. That is, someone who applied on the first day will have a lower case number compared to someone who did the application on the 2nd day or thereafter, if they are selected?
August 14, 2021 at 04:14
No it absolutely does NOT mean that!
May 26, 2022 at 13:33
Hi Simon, have shared only LinkedIn details on the DS260 form though I am an Fb user too. Also spelling mistakes in working details. Will this be impacted for further processing? Kindly reply.
June 1, 2022 at 16:44
Probably not, but I cannot be certain.
August 15, 2021 at 19:21
Sorry I now understand better. In step two of removing fraudulent entries I guess there might be a lot they look at, (or the system misses some cases) other than double entries because I know of someone who was selected but later disqualified during the interview with the reason that he had multiple entries.
February 24, 2023 at 12:39
Hello Brit Simon, first of all, thank you for your great information. It helps me a lot. I’m a DV2023 selectee from Tehran Iran. My related embassy is Ankara-Turkey. My case No. is between AS10,000 to 11,000. I heard a lot of bad news about Ankara embassy to delay in inviting the current cases and is not working well. Consider to current cases of Iran at 5500 up to now and delay in Ankara, Should I worry about Ankara embassy?
Are you recommending me to change my embassy from Ankara to another embassy like Yerevan or Abu Dhabi? Do you recommend another embassy instead of these?
Would you please help me to make a good decision. I am so nerves and under family pressure to make a good move.
Thanks in advance
Best Regards
Farhad
February 26, 2023 at 10:09
I cannot make that decision for you. It’s a gamble, and the gamble is for a greencard. Do what you think is best. You should understand of course that you have high risk as you are an Iranian male.